
Page 57 - 2019_08-Haematologica-web
P. 57
Rapid growth and hepcidin suppression in infancy
We demonstrate that a marked decline in iron status through infancy is reflected by progressive reduction in hepcidin concentrations, and that while hepcidin appears to be regulated by similar factors in infants, older children and adults, weight gain is the most prominent dynamic predictor of the extent of hepcidin decline in infants. The data highlight post-natal growth as being strongly associ- ated with the onset of iron depletion, and potentially asso- ciated with downstream sequelae, including anemia in vulnerable populations of infants.
The decline of hepcidin during infancy observed in both cohorts is consistent with data from previous smaller studies in Zimbabwean and Kenyan infants,33-35 which likewise described more pronounced effects in males. The parallel declines in hepcidin and ferritin, at a time when inflammation (which would be expected to increase both markers) is rising, illustrate the rapidity and severity of the onset of ID. Contrasting the dynamics of hepcidin in African infants, hepcidin levels were reported as stable during the first year in Europeans,36,37 presumably reflect- ing higher iron provision in weaning diets and lower cumulative exposure to infection and consequent inflam- mation. Human breastmilk has a low iron content5 and
Gambian babies are predominantly breastfed for the first 6 months and beyond.38 Moreover, as our data demon- strate, inflammation, infection and the season when infec- tions are more prevalent were all associated with relative- ly raised hepcidin concentrations, even in cases of low iron status, potentially contributing to iron depletion in African infants.
One notable observation was the dramatic depletion of plasma iron between birth and 5 months of age to concen- trations well below the previously described typical levels in infancy;31 these low levels persisted throughout the remainder of the first year. Availability of plasma iron is critical for supplying iron-demanding tissues. During infancy, iron is essential for erythropoiesis, but is also required by the developing brain which is a key consumer of iron,4 as well as by muscle and for tissue accretion.39 The proportional iron demands of these tissues are not constant through the first year of life: for example, ery- thropoietin levels and erythropoietic output are relatively low in neonates,32 despite early infancy being a period of rapid growth. Effective adaptive immunity, critical in LMIC infants, also requires iron; this is demonstrated by the recent discovery that a mutation in the Tfrc gene
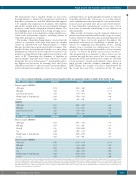
Table 4. Cross-sectional multivariate associations between hepcidin, ferritin and explanatory variables in infants at five months of age.
A. VPM – 12 months – N=114
Outcome variable: HEPCIDIN sTfR, mg/L
CRP,mg/L
Infection in last 4 weeks
Weight change (0-12 months), kg Season
FERRITIN
sTfR, mg/L
CRP,mg/L
Infection in last 4 weeks Sex
B. VA – 12 months – N=193
Outcome variable: HEPCIDIN sTfR, mg/L
CRP,mg/L
Hb, g/dL
Sex
Weight change (0-12 months), kg Season
Outcome variable: FERRITIN
sTfR, mg/L
CRP,mg/L
Hb, g/dL
Sex
Weight change (0-12 months), kg
Season
Coefficient
-1.708 0.221 0.167 -2.833 0.343
-1.200 0.170 0.223 -0.247 Coefficient
-1.191 0.163 0.330 -0.287 -1.362 0.267
-1.450
0.109
0.275
-0.055
-1.325
0.112
95% CI
-2.568 – -0.849 0.100 – 0.342 -0.068 – 0.401 -5.583 – 0.082 0.104 – 0.582
-2.225 – -0.175 0.001 – 0.339 -0.089 – 0.537 -0.535 – 0.040 95% CI
-1.870 – -0.511 0.040 – 0.286 -1.784 – 2.443 -0.485 – -0.089 -4.298 – 1.574 0.081 – 0.453
-2.095 – -0.805
-0.016 – 0.234
-1.844 – 2.395
-0.243 – 0.132
-4.168 – 1.518
-0.077 – 0.301
P
<0.001 <0.001 0.163 0.044 0.005
0.022 0.049 0.161 0.091 P
0.001 0.009 0.760 0.005 0.363 0.005
<0.001
0.087
0.799
0.562
0.361
0.247
The outcome variables hepcidin and ferritin were handled using Seemingly Unrelated Regressions, with World Health Organization birth weight-for-age Z-score used as an instru- ment for weight change. Only variables with P<0.2 in univariate regressions were included in multivariable models, omitting correlated indices as described in the Methods sec- tion.Data summarize 100 datasets in which any missing data were imputed using multiple imputation as described in detail in the Methods section and the Online Supplementary Appendix. Infection was coded as “no infection=0” and “occurrence of infection=1’; Season was coded as “dry season (November-June)=0” and “wet season (July-October)=1”; Sex was coded as“female=0”and“male=1”.
haematologica | 2019; 104(8)
1549
