
Page 56 - 2019_08-Haematologica-web
P. 56
A.E. Armitage et al.
enable estimation of within-child effects, contrasting the above cross-sectional models. Moreover, standardizing coefficients allows comparison of the relative effect sizes of explanatory variables on outcome variables (Tables 5 and 6 and Figure 2).
Infection and increases in CRP over time associated with increasing hepcidin, while rising sTfR predicted hep- cidin decline within infants, suggesting the models cap- tured effects on hepcidin in expected directions. Increased plasma iron over time associated with decreased hepcidin in both cohorts. In the VPM dataset, the transition from dry to wet season, when infections are more prevalent, also associated with increased hepcidin (Table 5 and Figure 2A).
However, consistent with the cross-sectional (i.e. between-infant) analyses, the dynamic predictor of hep- cidin decline that had the largest effect size in fixed effects models (i.e. within-infant) in both cohorts was weight gain (Tables 5 and 6 and Figure 2). The effect of weight gain on hepcidin suppression was highly significant in all groups of infants but was most pronounced in males: that is, a given increase in weight had a stronger suppressive effect on hepcidin over time in males (especially those
born in the lower birthweight group in VPM) than in females. Weight gain also significantly predicted ferritin decline in both cohorts (in contrast to the multivariate cross-sectional analyses at 5 and 12 months). The effect of weight gain on ferritin decline, like hepcidin, was larger in males in the VPM cohort (Table 5 and Figure 2A) although no sex difference on ferritin was observed in the VA cohort.
Discussion
Hepcidin is the key regulator of iron absorption and dic- tates whether absorbed iron is sequestered or made avail- able in the circulation.10 Understanding how hepcidin is regulated is therefore vital in understanding the differen- tial drivers of iron status, and how and whether iron inter- ventions aimed at combating ID might be effectively tar- geted.6 Here, we have taken advantage of serial sampling of infants from two Gambian cohorts to describe changes in hepcidin and ferritin levels during the first year of life, and to examine how they are influenced by different fac- tors using both cross-sectional and time series analysis.
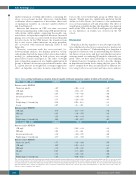
Table 3. Cross-sectional multivariate associations between hepcidin, ferritin and explanatory variables in infants at five months of age.
A. VPM – 5 months – N=114
Outcome variable: HEPCIDIN Plasma iron, μmol/L
sTfR, mg/L
CRP,mg/L
Infection in last 4 weeks
Sex
Weight change (0-5 months), kg Season
Outcome variable: FERRITIN
sTfR, mg/L
CRP,mg/L
Sex
Weight change (0-5 months), kg
B. VA – 5 months – N=193
Outcome variable: HEPCIDIN sTfR, mg/L
CRP,mg/L
Infection in last 4 weeks Weight change (0-5 months), kg
Outcome variable: FERRITIN
Plasma iron, μmol/L sTfR, mg/L CRP,mg/L
Hb, g/dL
Sex
Weight change (0-5 months), kg
Coefficient
-0.127 -0.641 0.218 0.103 -0.050 -5.543 0.247
-1.076 0.265 -0.251 -1.828 Coefficient
-0.700 0.148 -0.054 -3.307
0.057
-1.127
-0.031
1.627
-0.066
-0.173
95% CI
-0.252 – -0.002 -1.592 – 0.310 -0.076 – 0.513 -0.144 – 0.350 -0.238 – 0.139 -8.786 – -2.300 0.080 – 0.413
-2.11 – -0.039 -0.043 – 0.574 -0.463 – -0.039 -0.463 – 1.607 95% CI
-1.362 – -0.039 0.033 – 0.263 -0.283 – 0.175 -6.069 – -0.545
-0.129 – 0.244
-1.953 – -0.301
-0.175 – 0.113
-1.000 – 4.253
-0.347 – 0.216
-4.364 – 4.018
P
0.047 0.186 0.145 0.412 0.606 0.001 0.004
0.042 0.092 0.020 0.297 P
0.039 0.012 0.645 0.019
0.545
0.008
0.670
0.224
0.648
0.935
The outcome variables hepcidin and ferritin were handled using Seemingly Unrelated Regressions, with World Health Organization birth weight-for-age Z-score used as an instru- ment for weight change. Only variables with P<0.2 in univariate regressions were included in multivariable models, omitting correlated indices as described in the Methods sec- tion.Data summarise 100 datasets in which any missing data were imputed using multiple imputation as described in detail in the Methods section and the Online Supplementary Appendix. Infection was coded as “no infection=0” and “occurrence of infection=1’; Season was coded as “dry season (November-June)=0” and “wet season (July-October)=1”; Sex was coded as“female=0”and“male=1”.
1548
haematologica | 2019; 104(8)
