
Page 59 - 2019_08-Haematologica-web
P. 59
Rapid growth and hepcidin suppression in infancy
time. In the within-subject analyses, there was also a high- ly significant effect of weight gain on ferritin decline, apparently contrasting the cross-sectional models in which no association of ferritin with weight gain was found; this discrepancy likely reflects the better efficiency of analyzing data longitudinally.
The hepcidin-suppressive effect of rapid growth there- fore warrants mechanistic evaluation. It may relate to known hepcidin-regulatory signals, such as decreased transferrin saturation and hepatic iron. Growth factors, especially insulin-like growth factor 1 (IGF-1), play impor- tant roles in infant growth and development;42 hepatocyte growth factor (HGF), epidermal growth factor (EGF), and platelet-derived growth factor BB (PDGF-BB) are able to down-regulate hepcidin transcription.43,44 These or related growth factors should, therefore, be considered as candi- date contributors to hepcidin suppression during infancy. Furthermore, erythroferrone provides a precedent for an iron-demanding process, erythropoiesis, evolving to pro- duce a hepcidin suppressive hormone to facilitate iron supply. Further consideration should be given to the extent to which decreasing transferrin saturation due to, or erythroferrone derived from, an expanding erythron accounts for the observed relationship between rapid growth and hepcidin suppression and iron depletion at
different stages of infancy, compared to growth and devel- opment of other tissues such as muscle and brain. Whether non-erythroid iron-demanding tissues that grow rapidly during infancy similarly up-regulate erythrofer- rone itself or other, as yet undefined, signals should be investigated.
The proportional effect of weight gain on hepcidin was
also more pronounced in males. This sex difference might
reflect differences in hormonal regulation of hepcidin
exacerbating effects of weight gain: for example, testos-
terone suppresses hepcidin in mice45 and humans,46 and is
elevated in males during the 'mini-puberty' of early infan- cy.47
The availability of two well-sized cohorts providing longitudinal data provides a key strength of the analyses presented here, allowing investigation of factors affecting changes in hepcidin and ferritin within infants through the first year. Causal inference using longitudinal data faces two sources of confounding: time-variant confounding and time-invariant confounding. Unlike other regression models, fixed effects panel models control for any time- invariant confounding, measured or unmeasured. Despite this benefit, our models are still unlikely to fully capture all potential time-variant explanatory variables, limiting inference of causation. Since our analyses were retrospec-
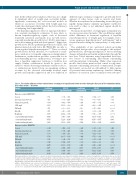
Table 6. The relative influence of time-variant factors on changes in hepcidin and ferritin over time during the first year of life in Gambian infants: fixed effect models – VA cohort.
Variable
Outcome variable:HEPCIDIN Season
Infection in last 4 weeks Plasma iron, μmol/L
sTfR, mg/L CRP,mg/L Hb, g/dL Weight, kg
lower birthweight females ower birthweight males higher birthweight males
Outcome variable: FERRITIN
Season
Infection in last 4 weeks Plasma iron, μmol/L sTfR, mg/L
CRP,mg/L
Hb, g/dL
Weight, kg
lower birthweight females lower birthweight males higher birthweight males
Coefficient (unstandardized)
0.063 0.116 -0.194 -1.161 0.133 0.115 -1.581 -0.484 -0.745 -1.226
-0.044 0.073 -0.008 -1.762 0.014 -0.158 -2.278 0.273 0.254
-0.164
95% CI (unstandardized)
-0.040 – 0.166 0.009 – 0.224 -0.342 – -0.466 -1.513 – -0.809 0.060 – 0.205 -0.610 – 0.840 -2.342 – -0.819 -1.083 – 0.116 -1.229 – -0.260 -1.819 – -0.633
-0.154 – 0.065 -0.078 – 0.225 -0.137 – 0.120 -2.205 – -1.319 -0.048 – 0.076 -1.354 – 1.037 -3.165 – -1.391 -0.494 – 1.039 -0.606 – 1.115
-1.011 – 0.683
Coefficient (standardized)
0.038 0.072 -0.204 -0.316 0.160 0.012 -0.347 -0.106 -0.163 -0.269
-0.024 0.042 -0.008 -0.442 0.016 -0.015 -0.461 0.055 0.051 -0.033
95% CI (standardized)
-0.024 – 0.100 0.005 – 0.140 -0.356 – -0.052 -0.406 – -0.225 0.073 – 0.246 -0.061 – 0.084 -0.516 – -0.179 -0.238 – 0.026 -0.270 – -0.057 -0.398 – -0.140
-0.085 – 0.036 -0.045 – 0.129 -0.132 – 0.115 -0.552 – -0.332 -0.053 – 0.084 -0.126 – 0.096 -0.641 – -0.281 -0.100 – 0.211 -0.122 – 0.225 -0.205 – 0.139
P
0.231 0.035 0.009 <0.001 <0.001 0.751 <0.001 0.112 0.003 <0.001
0.425 0.338 0.895 <0.001 0.651 0.792 <0.001 0.481 0.558 0.700
Data represent the pooled analysis of 100 datasets in which any missing data were imputed by multiple imputation, combined using Rubin’s combination rules, as described in detail in Online Supplementary Methods. Unstandardized coefficients indicate the effect of a unit change over time of an explanatory variable on changes over time within a child in the outcome variables hepcidin and ferritin,which were handled using seemingly unrelated regression to account for strong correlations between outcome variables. Standardized coefficients indicate the effect of a change of one standard deviation of an explanatory variable over time on standard deviation of outcome variables over time within a child. Infection was coded as “no infection=0” and “occurrence of infection=1’; Season was coded as “dry season (November-June)=0” and “wet season (July- October)=1”; Sex was coded as “female=0” and “male=1”. Interactions of weight change with birthweight group (groups indicated in italics: above or below WHO weight-for-age z-score of -0.5) and sex were modeled with coefficients/P-values representing differences for weight change relative to higher birthweight females as reference group.
haematologica | 2019; 104(8)
1551
