
Page 179 - 2019_08-Haematologica-web
P. 179
ATRA protects impaired BM MSC in ITP
IL-1β in bone marrow supernatants, as well as downregu- lated IL-1β fluorescence intensity and reduced TUNEL+CD90+ MSC in the central marrow (Online Supplementary Figures S4D and S5D). In contrast, the group treated with 5 mg/kg ATRA did not show marked improvement of the above-mentioned parameters (Figure 5A-D, G, Online Supplementary Figures S4C and S5C).
The group treated with 20 mg/kg ATRA displayed increased CXCL12 fluorescence intensity in the central marrow and decreased intensity in the bone-associated marrow (Figure 5H), implying a reversal of the CXCL12 gradient toward the vascular niche. A reduction in vascu- lar area and restoration of megakaryocytes associated with sinusoids in the marrow were also demonstrated in this group (Figure 5H-K). The group treated with 5 mg/kg did not show significant changes in vascular area or megakaryocyte occupation. These results mirrored the complement activation, CXCL12 and megakaryocyte shift
I
J
toward the bone-associated marrow in ITP mice. Administration of 20 mg/kg ATRA could regulate the CXCL12 and megakaryocyte shift toward the vasculature and promote platelet production.
Clinical responses to all-trans retinoic acid in patients with immune thrombocytopenia
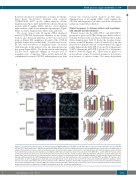
Patients from both the MSC-ITP-C+ and MSC-ITP-C- groups were given oral ATRA (10 mg twice daily) and con- comitant therapy with oral danazol (200 mg twice daily). Online Supplementary Table S2 shows the baseline charac- teristics of the ITP patients. At the 12-week follow up, the proportion of patients with an overall response was signif- icantly higher in the MSC-ITP-C+ group (19 of 26 patients, 73.08%) than in the MSC-ITP-C- group (13 of 32 patients, 40.63%; P=0.013) (Figure 6C). There were no grade 3 or worse adverse events. No patients required a dose reduc- tion because of adverse events. The main drug-related
Figure 6. (Continued from previous page). (H) Phosphorylation of MyD88, ERK1/2, p38 MAPK and NF-κB in MSC of patients from the MSC-ITP-C+ group (n=8) and the MSC-ITP-C- group (n=8) before and after treatment with ATRA. Student t-tests for comparisons between pre-treatment groups. Paired t-tests for comparisons of samples from patients in the pre- and post-treatment groups. (I) Representative images of radioactive in situ hybridization with CXCL12 antisense probe [CXCL12 transcripts: brown pseudocolor; 4′,6-diamidino-2-phenylindole (DAPI): blue] on marrow sections of the patients from the MSC-ITP-C+ and the MSC-ITP-C- groups. Ratio of CXCL12 transcript area in the bone-associated region (between 0-100 μm from the endosteal surface within the diaphysis) compared to an immediately adjacent region of the same size (between 100-200 μm from the endosteal surface) for ITP patients before and after ATRA treatment. (J) Representative images of bone mar- row immunohistochemistry for CD41 (megakaryocytes, green) and CD31 (vascular endothelium, red) for patients from the MSC-ITP-C+ and MSC-ITP-C- groups. (K, L) Quantification of CD41+ megakaryocytes physically associated with CD31+ vessels (between 0-10 μm from the sinusoidal endothelium within the diaphysis) and in the bone-associated region (within 100 μm of the endosteal surface within the diaphysis). (M, N) CD41+ megakaryocytes per section and vessel densities by immuno- fluorescence staining for CD31. (I, K-N) The MSC-ITP-C+ group, n=36; the MSC-ITP-C- group, n=36; Scale bar: 100 μm; χ2 tests for comparisons between pre-treatment groups. Paired t-tests for comparisons of samples from patients in the pre- and post-treatment groups.
KL
MN
haematologica | 2019; 104(8)
1671
