
Page 178 - 2019_08-Haematologica-web
P. 178
X. Zhu et al.
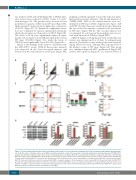
etic markers CD34 and CD45 (Figure 5E). CCK8 prolifer- ative assays were conducted on MSC at days 1, 3, and 7 with passages 7-12. The growth curves showed a lower proliferative capacity of MSC from ITP mice (Figure 5B), while annexin V studies showed a higher rate of apoptosis (P<0.001) (Figure 5C, D). Enhanced complement activa- tion was confirmed by marrow immunohistochemistry, which showed increased deposition of C5b-9 (Figure 5F). The levels of IL-1β were significantly higher in super- natants of bone marrow from ITP mice than in those from WT mice (P=0.000) (Figure 5G), while the levels of CXCL12 were significantly lower (P=0.011) (Figure 5G).
Similar to the findings in the marrow of patients from the MSC-ITP-C+ group, CXCL12 fluorescence intensity was increased in the bone-associated marrow and decreased in the central marrow in ITP mice (Figure 5H),
implying a CXCL12 gradient toward the endosteal niche. Increased fluorescence intensity of IL-1β and numbers of TUNEL+CD90+ MSC in the central marrow were also identified in ITP mice (Online Supplementary Figures S4B and S5B). Notably, there was a marked vascular dilation in the area of the bone marrow occupied by the vasculature in ITP mice (Figure 5H, K). The vascular dilation was accompanied by a decrease in the megakaryocytes associ- ated with sinusoids in ITP mice (Figure 5H-J).
ATRA (5 mg/kg or 20 mg/kg dissolved in dimethyl sul- foxide) was administered for 10 days by intraperitoneal injection. The platelet counts in the group treated with 20 mg/kg ATRA recovered, although they remained below the platelet counts of WT mice (Figure 5A). This group also exhibited improved MSC proliferation (Figure 5B) and less MSC apoptosis (Figure 5C, D), decreased levels of
ABCD
E
F
G
H
Figure 6. In vivo treatment with all-trans retinoic acid improved the function of bone marrow mesenchymal stem cells from patients with immune thrombocytope- nia. (A, B) The effect of all-trans retinoic acid (ATRA) on peripheral platelet counts of the two groups of patients with immune thrombocytopenia (ITP) [MSC-ITP-C+ patients with ITP with complement deposition on their mesenchymal stem cells (MSC); MSC-ITP-C-: patients with ITP without complement deposition on their MSC]. MSC-ITP-C+ group (n=26) and MSC-ITP-C- group (n=32). Paired t-tests. (C) The proportions of patients with an overall response (OR) or response (R) in the MSC-ITP- C+ group (n=26) and the MSC-ITP-C- group (n=32). Student t-tests. (D) The growth curves of bone marrow MSC from patients in the MSC-ITP-C+ group (n=26) and the MSC-ITP-C- group (n=32) before and after treatment with ATRA. Covariance analyses. (E) Cell apoptosis of bone marrow MSC of the patients from the MSC-ITP-C+ group (n=26) and the MSC-ITP-C- group (n=32) before and after treatment with ATRA. χ2 tests for comparisons between pre-treatment groups. Paired t-tests for com- parisons of samples of patients from pre- and post-treatment groups. (F, G) The levels of interleukin-1β (IL-1β) and CXCL12 in MSC lysates (MSC-ITP-C+ group, n=26; MSC-ITP-C- group, n=32; paired t-tests). (Continued on next page)
1670
haematologica | 2019; 104(8)
