
Page 176 - 2019_08-Haematologica-web
P. 176
X. Zhu et al.
nisms underlying the response to ATRA, MSC from ITP patients and healthy volunteers were treated with ATRA. As was foreseeable, exposure of MSC-ITP-C+ to ATRA led to marked proliferation and a reduced rate of apoptosis (Figure 4A, B). Downregulated secretion of IL-1β and upregulated levels of CXCL12 were found in the treated MSC-ITP-C+ group (Figure 4C, D). Levels of IL-1β and CXCL12 in MSC cell lysates were regulated accordingly (Figure 4E, F). Distinctly, the treated group showed inhib- ited phosphorylation of MyD88, ERK1/2, p38 MAPK and NF-κB (Figure 4G). No significant differences in prolifera- tive capacity, apoptosis rate, cytokine secretion and signal- ing pathways were observed in either the MSC-ITP-C- group (Online Supplementary Figure S6) or the MSC-control group (Online Supplementary Figure S7) before or after the administration of ATRA.
We further examined the potential genetic mechanism
of the suppressive effect of ATRA on IL-1β in MSC-ITP- C+. Analysis of the expression of the gene encoding IL-1β showed a dramatic, significant expression of IL-1β mRNA levels by MSC-ITP-C+ (Figure 4H). ATRA produced a modest decrease in IL-1β mRNA expression of MSC-ITP- C+, while it had no effect on IL-1β mRNA levels of MSC- ITP-C- and MSC-control (Figure 4H). CXCL12 mRNA lev- els were downregulated in MSC-ITP-C+ and could be increased by the administration of ATRA (Figure 4I). The frequency of DNA hypermethylation of the IL-1β promot- er in MSC-ITP-C+ was significantly lower than that in MSC-ITP-C- and MSC-control (Figure 4J). ATRA-treated MSC-ITP-C+ had higher DNA methylation of the IL-1β promoter (Figure 4J). We further analyzed the percentage methylation at the -299, -256, -20 and +13 CpG sites in the IL-1β promoter (Figure 4K). The percentage methyla- tion was 50%, 40%, 15%, and 18% at the -299, -256, -20,
ABC
D
E
FG
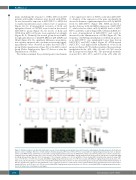
Figure 5. All-trans retinoic acid directed functional recovery of bone marrow mesenchymal stem cells from mice with immune thrombocytopenia. (A) Peripheral platelet counts of wildtype (WT) mice (n=15), immune thrombocytopenia (ITP) mice (n=15), ITP mice treated with a 5 mg/kg intraperitoneal injection of all-trans retinoic acid (ATRA) (n=11) and ITP mice treated with a 20 mg/kg intraperitoneal injection of ATRA (n=13). Tukey tests. (B) The growth curves of bone marrow mes- enchymal stem cells (MSC) from WT mice (n=6), ITP mice (n=6), ITP mice treated with ATRA 5 mg/kg intraperitoneal injection (n=6) and ITP mice treated with ATRA 20 mg/kg intraperitoneal injection (n=6) at passages 7-12. Covariance analyses. (C, D) Cell apoptosis of bone marrow MSC determined by annexin V assays (WT mice, n=6; ITP mice, n=6; ITP mice treated with ATRA 5 mg/kg intraperitoneal injection, n=6; ITP mice treated with ATRA 20 mg/kg intraperitoneal injection, n=6; Tukey tests). (E) The phenotypes of mice bone marrow MSC identified by flow cytometer. (F) C5b-9 deposition (green) assayed by marrow immunohistochemistry of WT mice and ITP mice (CD31, vascular endothelium, red). S, sinusoid. Scale bar: 0.1 mm. (G) The levels of interleukin-1β (IL-1β) and CXCL12 in bone marrow super- natants (WT mice, n=6; ITP mice, n=6; ITP mice treated with ATRA 5 mg/kg intraperitoneal injection, n=6; ITP mice treated with ATRA 20 mg/kg intraperitoneal injec- tion, n=6; Tukey tests). (Continued on next page)
1668
haematologica | 2019; 104(8)
