
Page 164 - 2019_08-Haematologica-web
P. 164
S. Wichaiyo et al.
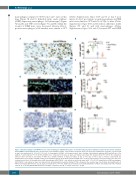
macrophages compared to WT but not Gp6-/- mice at this time (Figure 7B and C). Inducible nitric oxide synthase (iNOS)-expressing macrophages (M1 phenotype) (Figure 7D and E) and TNF-α level (Figure 7G and H) within the wound of DKO mice were decreased whereas Fizz-1- positive macrophages (a M2 marker) were similar to WT
(Online Supplementary Figure S5D and E) at day 3 post injury. At day 9 post injury, wound macrophages in DKO mice were similar to WT and Clec1bfl/flPf4-cre mice (Online Supplementary Figure S5D and E) with no difference in M1 (Figure 7D and F) and M2 macrophages (Online Supplementary Figure S5A and C) between WT and DKO
AB
C
DE
F
GH
Figure 7. M1 macrophages and TNF-α level are reduced during the inflammatory phase of wound healing in platelet immunoreceptor tyrosine-based activation motif (ITAM) receptor-deficient mice. (A) Detection of macrophages (F4/80+ cells; brown) in wound at day 3 post injury. (B) Quantification of F4/80+ cells in wound at day 3 post injury (n=6-8). *P<0.05; **P<0.01. (C) Comparison of F4/80+ cells between day 1, day 3, and day 9 post injury in wild-type (WT) and DKO mice. The symbols * and § indicate P<0.05 in WT and DKO mice, compared to the data at day 1 post injury, respectively. The bracket shows P<0.05 for the comparison between day 3 and day 9 post injury in §DKO mice. Sample numbers at days post injury: at day 1, n=5; day 3, n=6-9; day 9, n=10-13, respectively. (D) Immunofluorescence double staining of iNOS (red) and F4/80 (green) in the wound of WT and DKO mice at day 3 (n=4) and day 9 (n=4) post injury. Hoechst coun- terstains nuclei (blue). (E) Quantification of M1 macrophages (iNOS+F4/80+ cells; yellow) at day 3 post injury (n=4). *P<0.05. (F) Quantification of M1 macrophages (iNOS+F4/80+ cells; yellow) at day 9 post injury (n=4). (G) Immunohistochemistry staining of TNF-α (brown) in the wound at day 3 post injury. (H) Quantification of TNF-α level in granulation tissue area at day 3 post injury (n=6). *P<0.05. Graphs are presented as mean±Standard Error of Mean and analyzed by either Student t-test (E, F) or one-way ANOVA with Bonferroni’s multiple comparison test (B, C, and H). Scale bar = 20 μm.
1656
haematologica | 2019; 104(8)
