
Page 165 - 2019_08-Haematologica-web
P. 165
Platelet GPVI and CLEC-2 in skin wound healing
strains. Gp6-/- mice showed a lower number of macrophages within the wound scar than in Clec1bfl/flPf4- cre mice at day 9 post injury (Online Supplementary Figure S5E).
Overall, these data illustrate that CLEC-2 deletion pro- motes leukocyte sequestration in the wound during the inflammatory phase, especially macrophages. Deletion of both ITAM receptors leads to a significant reduction in wound neutrophils and M1 macrophages during this phase and a decrease in TNF-α expression in the tissue.
Inhibition of CLEC-2-podoplanin axis accelerates wound healing in GPVI-deficient mice
Clec1bfl/flPf4-cre and DKO mice present with blood/lym- phatic mixing and moderate thrombocytopenia.11,17 To investigate the influence of these defects on wound heal- ing, we injected Gp6-/- mice with an antibody to podoplanin (anti-podoplanin-treated Gp6-/- mice) that blocks CLEC-2-podoplanin interaction. A significant acceleration in wound healing was observed in anti- podoplanin-treated Gp6-/- mice at day 2 and day 3 post
AB
C
D
E
FG
HI
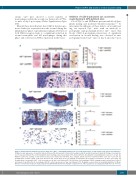
Figure 8. Anti-podoplanin antibody injection in Gp6-/- mice (Gp6-/- + anti-PDPN) simulates the accelerated phenotype of skin wound repair observed in DKO mice. (A) Macroscopic appearance of wound at indicated time points. Arrow points to intra-skin bleeding around the wound at day 3 post injury. (B) Changes of wound size over 3 days post injury (n=5). (C) Hematoxylin & Eosin staining at day 3 post-injury (n=5). Arrow points the bleeding into surrounding skin. Scale bar = 20 μm. (D) Martius scarlet blue staining of skin wound at day 3 post injury. Red: old fibrin, blue: collagen, yellow: red blood cells/fresh fibrin. Scale bar = 200 μm. (E) Quantification of fibrin content (red) in the wound at day 3 post injury (n=5). (F) Staining of neutrophils (Gr-1; brown) in wound area at day 3 post injury. (G) Quantification of neutrophils (Gr-1+ cells) in wound area at day 3 post injury (n=5). (H) Detection of macrophages (F4/80 staining; brown) in wound area at day 3 post injury. (I) Quantification of macrophages (F4/80+ cells) in wound area at day 3 post-injury (n=5). All graphs are presented as mean±Standard Error of Mean. Kinetics of wound closure (B) are analyzed by two-way ANOVA with Bonferroni’s multiple comparison test. Other parameters are analyzed by Student t-test. *P<0.05.
haematologica | 2019; 104(8)
1657
