
Page 200 - 2019_07 resto del Mondo-web
P. 200
L. Bury et al.
lagen receptors were responsible for this peculiar pheno- type, we sequenced the GP6, ITGA2 and ITGB1 genes in our PT-vWD patient. However, we did not find any rare pathogenic variant or any common genetic variant associ- ated with decreased response to collagen. In addition, we assessed the expression of a2β1 by flow cytometry, which was also normal (Online Supplementary Table S1).
To assess whether the constitutive binding of vWF to GPIba was directly responsible for the increased PPF on type I collagen, we incubated control human megakary- ocytes with ristocetin (1.5 mg/mL) to induce vWF-GPIba binding, and evaluated their PPF on type I collagen. Control megakaryocytes incubated with ristocetin showed increased PPF on type I collagen, similar to PT- vWD megakaryocytes (Figure 2F), suggesting that the binding of vWF triggers proplatelet formation on collagen.
A significantly higher percentage of human PT-vWD megakaryocytes migrated through transwells coated with type I collagen in response to SDF1-a. In contrast, migra- tion through uncoated transwells, compared to control
human megakaryocytes (Figure 2G) or through transwells coated with vWF was normal (data not shown), confirming an altered interaction of PT-vWD megakaryocytes with type I collagen and not a generalized abnormality of migration.
Megakaryocyte intracellular signaling triggered by type I collagen
RhoA activation (RhoA-GTP formation) triggered by adhesion to collagen was lower in PT-vWD compared to control megakaryocytes (Figure 3A). Consistently, colla- gen-induced MLC2 phosphorylation, which depends on RhoA activation,14 was also impaired in PT-vWD megakaryocytes (Figure 3B). On the contrary, SFK phos- phorylation was significantly higher in resting PT-vWD than in control megakaryocytes but, differently from con- trol megakaryocytes, it did not increase further after adhe- sion to collagen (Figure 3C). Lyn showed the same activa- tion pattern as SFK (Figure 3D). Comparable results were obtained using mouse TgWT and TgG233V megakaryocytes
ABC
D
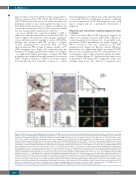
Figure 4. Platelets in bone marrow (BM) and platelet lifespan. (A) BM sections were stained using a primary rabbit-anti-human β1-tubulin antibody and a secondary biotinylated goat anti-rabbit IgG thus highlighting megakaryocytes and platelets; specimens were counterstained with Hematoxylin & Eosin (H&E). Scale bars=40 μm. Pictures were analyzed using Image J software and platelet number in BM was expressed as the number of platelets per 1000 μm2 of cell-covered slide surface (*P<0.05 vs. control). Ten different human BM sections were analyzed from the platelet-type von Willebrand disease (PT-vWD) patient, and ten each from three immune thrombocytopenia (ITP) patients and from three healthy controls. (B) Murine BM biopsies of TgWT and TgG233V mice were stained using a rabbit-anti-mouse CD41 antibody and a secondary biotinylated goat anti-rabbit IgG; specimens were counterstained with hematoxylin & eosin. Scale bars=40 μm. Pictures were analyzed using Image J software and platelet number was expressed as the number of platelets per 1000 μm2 of cells (right) (*P<0.05 vs. TgWT). Ten different BM sections were analyzed from each of three TgWT and three TgG233V mice. (C) TgWT (white circles) and TgG233V mice (gray circles) were injected with a DyLight 488-conjugated anti- GPIX mAb which confers to platelets a green fluorescence, and residual green fluorescent platelets were quantified by flow cytometry at different intervals from DyLight 488-conjugated anti-GPIX mAb injection. Data are expressed as the percentage of GPIX-positive platelets relative to the total CD41/61-PE positive platelet population with time=0 being arbitrarily set at 100%. Data represent mean±Standard Error of Mean (SEM) (n=4; *P<0.05 vs. TgWT). (D) von Willebrand factor (vWF) binding to human (a, c, e) and murine (b, d, f) platelets from EDTA-anticoagulated blood smears as assessed by fluorescence microscopy. vWF was not detected on the platelet surface of healthy controls (a) and TgWT mice (b), while it was bound to the platelet surface of the PT-vWD patient (60-80% of platelets) in the TgG233V mouse (70-90% of platelets) (c) and TgG233V mice (d). Platelet clumps linked by vWF were present in the circulation of the platelet-vWD (PT-vWD) patient (e) and TgG233V mice (f) but not of healthy controls and TgWT mice. vWF is stained red (Alexa Fluor® 568 Goat Anti-Rabbit IgG), CD42b is stained green (Alexa Fluor® 488 Goat Anti-rat IgG). Samples were mounted using the ProLong Antifade medium (Molecular Probes) and analyzed at room temperature using a Carl Zeiss Axio Observer.A1 fluorescence microscope (Carl Zeiss Inc., Oberkochen, Germany). Representative merging images are presented. Scale bars=5 μm, C: healthy control, P: PT-vWD. Data refer to blood smears from five healthy controls, five different blood samples from the PT-vWD patient and from five TgWT and five TgG233V mice.
1478
haematologica | 2019; 104(7)
