
Page 189 - 2019_07 resto del Mondo-web
P. 189
Molecular characterization of GFI1BQ287* mutation
Proteome changes in GFI1B p.Q287* platelets are not limited to a-granule protein depletion
GFI1BQ287* iPSC-derived megakaryocytic cells show phe- notypes that indicate aberrant differentiation. With platelets representing the final stage of megakaryopoiesis, we asked how this is translated to the platelet proteome. To identify the deregulated proteins, platelet protein levels of four GFI1BQ287*-affected individuals were compared to those of four healthy individuals using label-free quantita- tive mass spectrometry. Out of 2,550 quantified proteins,
1,005 proteins were differentially expressed between nor-
Q287*
mal and GFI1B platelets, with the expression of 395
proteins being reduced and that of 610 elevated in the case of the GFI1BQ287* mutation (Figure 6A,B; Online Supplementary Table S3). In line with the reported a-gran- ule deficiency,5 a-granule proteins such as VWF, THBS1, and platelet factor 4, showed markedly reduced levels in GFI1BQ287* platelets (Figure 6C). Of note, NBEAL2, which is mutated and causative for the a-granule deficiency in clas- sical gray platelet syndrome,31-33 was not among the pro-
AB
CD
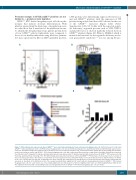
Figure 5. Differential protein expression between GFI1BQ287* and control induced pluripotent stem cell-derived megakaryocytic cells. (A) Protein levels in control and GFI1BQ287* induced pluripotent stem cell (iPSC)-derived megakaryocytic cells were determined using label-free quantification (LFQ) and differentially expressed pro- teins were determined using a two-sided t-test (P<0.05 and s0=0.5). The volcano plot shows the -log10-transformed P-value against the log2 fold change (FC) in relative protein levels between control and GFI1BQ287* iPSC-derived megakaryocytic cells, with each protein represented by a single point in the graph. Dashed lines represent the statistical cutoff. A negative FC indicates proteins with reduced levels and a positive FC indicates proteins with elevated levels in GFI1BQ287* iPSC-derived cells. (B) Heat-map and hierarchical clustering of the 396 differentially expressed proteins between control and GFI1BQ287* iPSC-derived cells. Heat-map colors are based on the z-scored (log2) LFQ values. Blue shades correspond to decreased expression levels and yellow shades to increased expression levels. Imputed values are shown in the case a protein was not detected. (C) Enrichment of Gene Ontology (GO) terms based on biological process, molecular function and cellular components was assessed as described in the Methods section. The overlap heat-map shows significant GO terms related to downregulated proteins in GFI1BQ287* iPSC-derived megakaryocytic cells. For each cluster, one or two summarizing terms are indicated. For a full list of significant GO terms see Online Supplementary Table S2. (D) The significant GO terms with corresponding P-values for upregulated proteins in GFI1BQ287* iPSC-derived megakaryocytic cells are shown.
haematologica | 2019; 104(7)
1467
