
Page 190 - 2019_07 resto del Mondo-web
P. 190
R. van Oorschot et al.
AB
C
DE
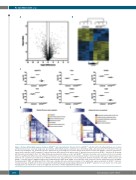
Figure 6. Proteins differentially expressed between GFI1BQ287* and control platelets. Platelets from four GFI1BQ287* patients and four healthy individuals were isolated and protein levels were assessed using mass spectrometry. Differentially expressed proteins were determined using a two-sided t-test (P<0.05 and s0=0.5). (A) Volcano plot showing the -log10-transformed P-value against the log2 fold change (FC) in relative protein levels between control and GFI1BQ287* platelets. Dashed lines represent the statistical cutoff. A negative FC indicates proteins with reduced levels and a positive FC indicates increased levels in GFI1BQ287* platelets. (B) Heat-map with hierarchical clustering for the 1,007 differentially expressed proteins between control and GFI1BQ287* platelets. Heat-map colors are based on the z-scored (log2) label-free quantification (LFQ) values. Blue shades correspond to decreased expression levels and yellow shades to increased expression levels. Imputed values are shown in case a protein was not detected. (C) Relative protein levels (log2 LFQ values) of selected α-granule proteins in platelets of healthy controls (circles) and GFI1BQ287* patients (squares). ANGPT1: angiopoietin-1; FGA: fibrinogen alpha chain; SPARC: secreted protein acidic and rich in cysteine; PF4: platelet factor 4; THBS1: thrombospondin-1; VWF: von Willebrand factor. (D-E) Gene ontology (GO) term enrichment analysis of the significantly expressed proteins in GFI1BQ287* platelets. Overlap heat-maps of significant GO terms associated with downregulated (D) and upregulated (E) proteins in GFI1BQ287* platelets. For each cluster, one or two sum- marizing terms are indicated. For a full list of significant GO terms see Online Supplementary Table S2.
1468
haematologica | 2019; 104(7)
