
Page 186 - 2019_07 resto del Mondo-web
P. 186
R. van Oorschot et al.
expressed elevated levels of CD34 in line with primary GFI1BQ287* megakaryocytes,5 while CD41a and CD42b expression was not different (Figure 4C-E). Quantification of the total number of CD41a+ cells between days 14-18 of iPSC differentiation showed that GFI1BQ287* iPSC produced 55-fold more megakaryocytic cells compared to control iPSC (Figure 4F), in line with the increased number of bone marrow megakaryocyte observed in GFI1BQ287*- affected individuals. Electron microscopy of control and GFI1BQ287* megakaryocytic cells showed the presence of a- granules in both conditions (Online Supplementary Figure S5). Together, these data indicate that the GFI1BQ287* iPSC- derived megakaryocytic cells resemble micromegakaryo- cytes that exhibit some phenotypes (CD34 expression, increased expansion) also observed in affected individuals.
Identification of GFI1B-regulated processes in early megakaryocyte differentiation
To determine deregulated protein expression down- stream of GFI1BQ287*, we compared the proteomes of GFI1BQ287* iPSC-derived CD41a+ megakaryocytic cells (n=6)
with those of controls (n=6). In total 2,906 proteins were quantified (Online Supplementary Table S1). We detected CD34 expression in GFI1BQ287* iPSC-derived cells, but not in control cells (Online Supplementary Table S1). The mass spectrometer was not sensitive enough to detect the lower CD34 expression on control cells versus GFI1BQ287* cells observed with flow cytometry. The results confirm the increased CD34 expression observed in the iPSC model system and patients’ platelets (Figure 4C). Major platelet receptors, including glycoprotein (GP)-IB, GPIX, and inte- grin aIIbβ3, as well as a-granule proteins such as von Willebrand factor (VWF) and thrombospondin-1 (THBS1), were not differentially expressed between control and GFI1BQ287* iPSC-derived megakaryocytic cells. However, 396 proteins were differentially expressed between the GFI1BQ287* and control iPSC-derived megakaryocytic cells, of which 252 were upregulated and 144 downregulated (Figure 5A,B; Online Supplementary Table S1). One of the most strongly downregulated proteins in GFI1BQ287* iPSC was the interferon-induced GTP-binding protein MX1, which was expressed strongly in control iPSC-derived cells
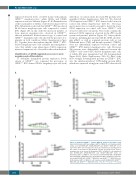
AB
CD
E
Figure 2. GFI1B and GFI1BQ287* regulate MEG-01 expansion via LSD1 recruit- ment. (A) Normalized GFP percentages (GFP%) of MEG-01 cells transduced with empty vector (EV)-IRES-GFP, GFI1B-IRES-GFP and GFI1BQ287*-IRES-GFP for 26 days (n=8). GFP% were normalized to day 5 after transduction (starting point of the culture) as described in the Methods. Results are shown as the mean ± standard error of the mean. (B) Normalized GFP% of MEG-01 cells transduced with EV-IRES-GFP, GFI1B-IRES-GFP, and GFI1BP2A-IRES-GFP (n=4). (C) Normalized GFP% of MEG-01 cells transduced with EV-IRES-GFP, GFI1B-IRES- GFP, and GFI1BK8A-IRES-GFP (n=3). (D) Normalized GFP% of MEG-01 cells trans- duced with EV-IRES-GFP, GFI1BQ287*-IRES-GFP, and GFI1BP2A+Q287*-IRES-GFP (n=3). (E) Normalized GFP% of MEG-01 cells transduced with EV-IRES-GFP, GFI1BQ287*- IRES-GFP, and GFI1BK8A+Q287*-IRES-GFP (n=4). *P<0.05, **P<0.01 ***P<0.001.
1464
haematologica | 2019; 104(7)
