
Page 185 - 2019_07 resto del Mondo-web
P. 185
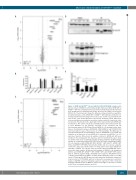
Molecular characterization of GFI1BQ287* mutation
AD
B
C
E
F
Figure 1. GFI1B and GFI1BQ287* interact with the LSD1-RCOR-HDAC complex. (A,C) Nuclear extracts of MEG-01 cells transduced with empty vector (EV), GFI1B-GFP, or GFI1BQ287*-GFP were analyzed by mass spectrometry. Statistically enriched proteins were identified by a permutation-based false discovery rate (FDR)-corrected t-test (FDR<0.01). The volcano plot shows the difference between label-free quantifica- tion (LFQ) intensities of the GFI1B-GFP or GFI1BQ287*-GFP pulldown and the EV con- trol [log2-transformed fold change (FC)] on the x-axis, and the -log10-transformed P- value on the y-axis. Dotted gray lines represent the statistical cutoffs, which were chosen such that no proteins were present as outliers on the EV control side of the volcano plot. The proteins in the upper right corner represent the bait (GFI1B) and its interactors. We cannot exclude the possibility that we missed interactions due to steric hindrance by the GFP-tag, especially at the C-terminal end. (B) Stoichiometry analysis of GFI1B interactors in MEG-01 cells showing relative abun- dances. Discrimination between GFI1B;GFI1, HDAC1;HDAC2, and RCOR1;RCOR3 was not possible because of the presence of common peptides. The iBAQ value of each interacting protein is plotted with the value for GFI1B;GFI1 set at 1. GFI1 was identified as an interactor of both GFI1B (all 3 replicates) and GFI1BQ287* (2 of 3 replicates, therefore filtered out). As peptides common to GFI1B and GFI1 were included in the normalization this may have affected stoichiometry values. Data are shown as the mean ± standard deviation of three pulldowns. (D) Western blot analysis of co-immunoprecipitated (IP) LSD1 after GFP-trap bead pulldown in MEG- 01 cells transduced with GFI1B-GFP (WT), GFI1BQ287*-GFP (Q287*), GFI1BP2A-GFP (P2A), and GFI1BK8A-GFP (K8A). Non-transduced (NT) cells were used as a negative control. The upper panel shows LSD1 (~90 kDa) and the lower panel GFI1B vari- ants-GFP (~58 kDa). The left side of the blot shows LSD1 and GFI1B-GFP expres- sion in the input samples. (E) Western blot analysis of MEG-01 cells transduced with EV, and GFI1B-GFP, GFI1BQ287*-GFP, GFI1BP2A-GFP, and GFI1BK8A-GFP stained with an antibody against GFI1B, identifying both exogenous GFI1B-GFP fusions (~58 kDa) and endogenous GFI1B (~37 kDa). Actin staining was used as a loading control. (F) Endogenous GFI1B expression (determined by quantitative polymerase chain reaction on 5’UTR GFI1B, which is not present in overexpression constructs) relative to GAPDH expression following exogenous expression of EV or indicated flag-tagged GFI1B variants in MEG-01 cultures from Figure 2. Results are shown as the mean ± standard deviation (n=3-11).
haematologica | 2019; 104(7)
1463
