
Page 104 - 2019_07 resto del Mondo-web
P. 104
W. Xiao et al.
MRD-neg group compared to the MRD-pos group [10% (95%CI: 2-24%) vs. 37% (95%CI: 18-56%); P=0.014].
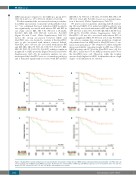
We then examined the association between post induc- tion MRD and survival. Consistent with published stud- ies,5-10 we confirmed that post induction MRD positivity was significantly associated with inferior OS and RFS in our study cohort [OS, HR 3.81 (95%CI: 1.18-12.25), P=0.017; RFS, HR 3.98 (95%CI: 1.4-11.31), P=0.007] (Figure 3A and C and Online Supplementary Table S2). Given the strong association between MRD and blast/PDC ratio, we decided to evaluate if the blast/PDC ratio is also associated with inferior survival. Indeed, blast/PDC ratio >10 was also associated with inferior OS and RFS [OS, HR 2.79 (95%CI: 0.98-7.97), P=0.077; RFS, HR 3.83 (95%CI: 1.51-9.74); P=0.007], which is similar in magnitude to MRD positivity (Figure 3B and D and Online Supplementary Table S2). In sensitivity analysis, we also investigated the blast/PDC ratio as a continuous predictor and it remained significantly associated with OS and RFS
[OS HR 1.32 (95%CI: 1.08-1.61), P=0.006; RFS, HR 1.38 (95%CI: 1.16-1.65), P<0.001; based on a log-transforma- tion of the ratio] (Online Supplementary Table S2).
We next focused on patients achieving full CR (exclud- ing CRi and MLFS). Post induction MRD positivity was significantly associated with inferior RFS and OS [RFS, HR 4.39 (95%CI: 1.44-13.37), P=0.009; OS, HR 3.56 (95%CI: 0.99-12.73), P=0.051] (Online Supplementary Table S2). Blast/PDC >10 was also associated with inferior RFS of similar magnitude [HR 4.93 (95%CI: 1.71-14.2); P=0.003].
In order to examine the outcome prediction of individ- ual patients based on MRD and/or blast/PDC ratio, C-sta- tistics were performed.42 The estimated C-index using the inverse probability censoring weight for PFS was 0.80 for MRD positivity and 0.79 for the blast/PDC ratio >10. For OS, the C-index was 0.79 for MRD positivity and 0.73 for the blast/PDC ratio >10. Therefore, while the C-index was modestly higher for MRD, both markers show a high degree of discrimination for survival.
AB
P=0.017 CD
P=0.007
P=0.077
Figure 3. Kaplan-Meier survival analysis based on post-induction measurable residual disease (MRD) status and blast/plasmacytoid dendritic cell (PDC) ratio. (A) Overall survival (OS) of MRD-neg and MRD-pos groups. (B) Relapse-free survival (RFS) of MRD-neg and MRD-pos groups. (C) OS of blast/PDC ratio <10 and >10 groups. (D) RFS of blast/PDC ratio <10 and >10 groups. neg: negative; pos: positive.
P=0.007
1382
haematologica | 2019; 104(7)
