
Page 102 - 2019_07 resto del Mondo-web
P. 102
W. Xiao et al.
events provided at least 100,000 events are acquired in each of the three panels used. MRD detected using MFC was defined by the presence of any abnormal bone marrow blast population meeting the above criteria.41
Plasmacytoid dendritic cells were identified by low side scatter, moderate CD45, bright CD123 and HLA-DR expression, and lack of expression of CD11b, CD13, CD14, CD34, CD64, CD56, CD3, or CD19. The expression of CD303/BDCA2, TdT, and TCL-1 was examined in six selected cases with identical quantitation. Blasts were identified by low side scatter, dim CD45, positive CD34 and/or positive CD117 expression, or presence of immature monocytic forms (bright for CD33, positive for CD64 and HLA- DR with dim to negative expression of CD14 and/or CD11b). PDCs and blasts were quantified as the percent of total white blood cells (WBC) that is defined by CD45 positivity.
Statistical analysis
A Wilcoxon rank-sum test compared the PDC number and the blast/PDC ratio across the cohorts of patients with AML (>20%), AML with residual disease, MRD positive disease, MRD negative disease, and non-AML controls. Cumulative incidence functions and Gray’s test were used to estimate and compare the incidence of relapse by MRD status. Death in the absence of relapse was considered a competing risk. Kaplan-Meier survival curves and proportional hazards regression were used to estimate and com- pare overall survival and relapse-free survival by MRD status and by whether the blast/PDC ratio was >10. No adjustments were made for multiple comparisons. Analyses were conducted by GraphPad Prism and the R statistical language.
Results
Plasmacytoid dendritic cell proportion in control subjects
Previous studies showed that PDC were <1% in the marrow from healthy controls.32 In order to study the
AB
range of PDC in patients with cytopenia but with no mar- row-based disease, we chose two cohorts of patients: one with solid tumors who developed cytopenia at least six months after completing chemotherapy, and the other with no history of malignancies. These subjects, although mildly cytopenic, had no morphological, cytogenetic or molecular evidence of myeloid neoplasm or metastatic malignancy. PDC were quantified as the percent of total WBC by flow cytometry based on low side scatter, mod- erate CD45, bright CD123 and HLA-DR expression (Figure 1A and B). The identity of the PDC was further confirmed by the expression of CD303 in six cases. CD303 inclusion did not alter PDC quantitation (Online Supplementary Figure S1 and data not shown). We found the PDC proportion had a relatively narrow distribution with a median of 0.23% [interquartile range (IQR): 0.16%- 0.36%] (Figure 2A). In order to evaluate the interobserver variability of the measurement of PDC and blast propor- tions, three observers (WX, SS, NN) independently quan- tified PDC and blast proportions for ten patients. The interclass correlation coefficient (ICC) agreement was high for both PDC and blasts (0.98 and 0.99, respectively).
Marked reduction of plasmacytoid dendritic cell proportion in acute myeloid leukemia patients
We observed a markedly decreased proportion of PDC in most patients with AML (>20% blasts), with a median of 0.016% (IQR: 0.0019%-0.071%), more than 10-fold lower than observed in controls (Figure 1C and D and Figure 2). There was no significant difference in PDC pro- portions between newly diagnosed AML and persistent AML with >20% blasts (data not shown). Although a mild recovery of PDC proportion was observed in the patients with residual AML (>5%<20 blasts) after induction chemotherapy, the median of PDC proportion was
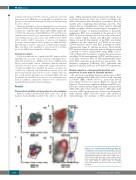
CD
Figure 1. Loss of plasmacytoid dendritic cell (PDC) dif- ferentiation in acute myeloid leukemia (AML). PDC from a control subject (A and B) reside in the CD45 dim/low side scatter gate between blasts and monocytes, over- lapping with basophils (A). PDC express high levels of CD123 and HLA-DR and can be easily separated from blasts and basophils (B). In AML with morphological dis- ease (≥20% blasts) (C and D), PDC are markedly reduced. Red: CD34 positive blasts; blue: PDC; purple: basophils.
1380
haematologica | 2019; 104(7)
