
Page 103 - 2019_07 resto del Mondo-web
P. 103
Plasmacytoid dendritic cells in AML
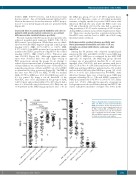
0.044% (IQR: 0.0073%-0.12%), still 5-fold lower than that in controls. Five of 136 AML patients (all had >20% blasts in the marrow) showed an increase in PDC propor- tion >1%: four newly diagnosed and one persistent AML (Figure 2A).
Increased blast to plasmacytoid dendritic cell ratio in patients with morphological remission is associated with measurable residual disease positivity
We next examined the PDC proportion in patients who achieved morphological remission (MLFS, CRi, CR by ELN criteria22) post induction. While there was no differ- ence between the MRD-negative (neg) and control groups [median 0.31% (IQR: 0.17%-0.49%) vs. 0.28% (IQR: 0.17%-0.34%)], the MRD-positive (pos) group had signif- icantly reduced PDC proportion compared to the control (median 0.074%, IQR: 0.022%-0.33%; Wilcoxon rank sum, P=0.019) (Figure 2A). Although significant differ- ences were observed, there was still a large overlap of PDC proportions among the groups. In an attempt to achieve better separation and to eliminate possible effects of hemodilution, we calculated the ratio of blast/PDC by using the proportions of blasts and PDC out of total WBC as quantitated by flow cytometry (Figure 2B). The IQR of the ratio was 341-17175 for AML, 37-385 for residual AML, 2.9-78 for MRD-pos, 2.0-3.2 for MRD-neg, and 1.1- 2.3 for control. By using a cut-off threshold of the blast/PDC ratio of 10, all patients in the groups of AML (>20% blasts) and residual AML (>5%<20% blasts) had a ratio of >10 and all controls had a ratio <10. Only one out of 36 patients in the MRD-neg group had a ratio >10. In
the MRD-pos group, 19 out of 33 (58%) patients had a ratio of >10. Therefore, a ratio of >10, while moderately sensitive, is highly specific for positive MRD status after induction. Overall, the area under the ROC curve was 0.79 and a threshold of 10 for the ratio had a correspon- ding specificity of 97.4% and a sensitivity of 58% for pre- dicting MRD positivity status (Online Supplementary Figure S2). There was a modest positive correlation between the blast/PDC ratio and the level of MRD: rho=0.543 using Spearman rank correlation.
Both measurable residual disease positivity and blast/plasmacytoid dendritic cell ratio >10 are strongly associated with inferior outcomes after induction
Among the 69 patients who achieved morphological remission (CR, CRi, and MLFS), 36 (52%) were MRD-neg and 33 (48%) MRD-pos as evaluated by the MFC DfN approach. As expected, the MRD-neg group showed younger age at presentation (median 52 vs. 62 years; unpaired t-test, P=0.0013), and more patients with favor- able CG (8 of 34 vs. 0 of 30; Fisher exact test, P=0.005; two MRD neg and three MRD pos patients had no CG results) and favorable ELN risk than MRD-pos group (18 of 36, 50% vs. 4 of 33, 12%; Fisher exact test, P=0.0008). After induction therapy, there was a trend in more MRD-neg patients achieving CR (vs. CRi and MLFS) compared to MRD-pos patients (32 of 36, 89% vs. 24 of 33, 72%; Fisher exact test, P=0.1). Although the majority of patients in both groups received consolidation therapy and HSCT, the 2-year cumulative incidence of relapse was lower in the
Figure 2. Quantification of plasmacytoid den- dritic cell (PDC) in acute myeloid leukemia (AML) and controls. (A) The PDC proportion of white blood cell count is significantly reduced in AML, residual AML and MRD-pos groups (Wilcoxon rank-sum test). (B) The blast/PDC ratio is markedly increased in AML, residual AML and MRD-pos groups. Interquartile range is shown. pos: positive; neg: negative.
A
P=0.0001
B
P=0.08
P=0.001
P=0.02
haematologica | 2019; 104(7)
1381
AML (≥20% blasts) Residual AML (>5% <20% blasts)
MRD-pos. (<5% blasts) MRD-neg. (<5% blasts)
control
AML (≥20% blasts) Residual AML (>5% <20% blasts)
MRD-pos. (<5% blasts) MRD-neg. (<5% blasts)
control
