
Page 105 - 2019_07 resto del Mondo-web
P. 105
Plasmacytoid dendritic cells in AML
In measurable residual disease-positive patients blast/plasmacytoid dendritic cell ratio <10 is associated with a higher measurable residual disease clearance rate
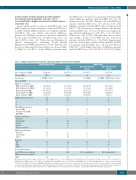
Given similar predictive values of blast/PDC ratio, and MRD despite moderate sensitivity of the blast/PDC ratio for MFC-defined MRD positivity, we examined whether blast/PDC ratio can further risk-stratify MRD-pos patients. The MRD-pos group was, therefore, subdivided based on the blast/PDC ratio: 15 (45%) had a ratio <10 and 18 (55%) a ratio >10. There were no differences in clinical characteristics including World Health Organization (WHO) classification, CG risk, ELN risk, and the rate of achieving CR between these two groups (Table 1). Only 8 of 15 (53%) of the MRD-pos patients with
blast/PDC ratio <10 received consolidation therapy while all the MRD-pos patients with blast/PDC ratio >10 did (Fisher exact test, P=0.003). Eleven of 15 of the MRD-pos patients with blast/PDC ratio <10 and 14 of 18 of the MRD-pos patients with blast/PDC ratio >10 had received HSCT. The proportion of relapse/death in the patients with blast/PDC ratio <10 was 2.5 times lower approach- ing statistical significance (3 of 15, 20% vs. 10 of 18, 56%; Fisher exact test, P=0.07). Although there was no differ- ence in OS, a trend of better RFS was also observed in patients with blast/PDC ratio <10 (Online Supplementary Figure S3). Additionally, estimated 18-month RFS of MRD- pos patients with blast/PDC ratio <10 was 0.53 (95%CI: 0.22-0.99), a little higher than that of MRD-pos patients with blast/PDC ratio >10 (0.39, 95%CI: 0.21-0.73) (Online
Table 1. Clinical characteristics of patients achieving complete remission after induction. MRD negative (N=36)
MRD positive
Age, median years (IQR)
Gender (M/F) Prior therapy† Prior allo-HSCT
CBC prior to induction
WBC, median x109/L (IQR) ANC, median x109/L (IQR) ‡ Hb, median g/dL (IQR)
PLT, median x109/L (IQR) Blasts, median % (IQR)
52 (42-60)*
17/19
2 (1 HMA, 1 other) 2
5.8 (2.5-15) 0.8 (0.2-1.6) 8.6 (7.4-11) 55 (28-105) 23 (7-60)
22
Total (N=33)
62 (57-70)
14/19 6
0
3.9 (1.7-12) 0.8 (0.3-2.3) 9.1 (8.1-11) 68 (35-155) 21 (2-40)
Blast/PDC ratio<10 (N=15)
62 (58-70)
6/9
2 (2 HMA) 0
4.4 (2.1-17) 0.8 (0.5-2.2) 9.2 (8.6-11) 58 (29-120) 23 (18-52)
Blast/PDC ratio>10 (N=18)
62 (57-69)
8/10
4 (2 HMA, 1 SGN33 trial, 1 other) 0
2.7 (1.7-11) 0.8 (0.2-2.2) 8.7 (7.9-10) 93 (46-166) 5 (2-30)
ECOG status documented 0
9
18
13 10 6 4
9 18835
21000
AML WHO classification
DenovoAML 28 23 11 12 Therapy-related AML 4 5 14 AML-MRC 4 5 3 2
CG risk stratification
Favorable|| 8 0 Intermediate 24 26 Normal 17 14 Adverse 2 4 Failedornotdone 2 3
ELN risk stratification§
Favorable 18 4 Intermediate 13 16 Adverse 5 13
Response
CR 32 24
CRi 4734 MLFS 0211
Consolidation therapy 30 27 8 19
Pre-HSCT/post consolidation N/A 8/28 6/12 (3 unavailable) 2/16 (2 unavailable)
MRD conversion to negative||
HSCT 26 25 9 16
Measurable residual disease (MRD) negative (neg) versus MRD positive (pos), P=0.01 MRD neg versus Blast/plasmacytoid dendritic cell (PDC) ratio <10. ||P=0.005 (Fisher exact) MRD neg versus MRD pos. §P=0.0008 (Fisher exact) MRD neg versus MRD pos. |P=0.02 (Fisher exact) Blast/PDC ratio <10 versus Blast/PDC ratio >10. ANC: absolute neutrophil count; Hb: hemoglobin; PLT: platelets; AML-MRC: AML with myelodysplasia-related changes; CG: cytogenetic; CR: complete remission; CRi: complete remission with incomplete counts recovery;MLFS:marrow leukemia free state.PDC:plasmacytoid dendritic cells;N:number;M:male;F:female;IQR:Interquartile Range;allo-HSCT:allogeneic hematopoi- etic stem cell transplantation; CBC: complete blood cell; WBC: white blood cell; ECOG: Eastern Cooperative Oncology Group; WHO: World Health Organization.
00 12 14 8 6 1 3 2 1
13 88 6 7
11 13
haematologica | 2019; 104(7)
1383
