
Page 170 - 2019_06-Haematologica-web
P. 170
A.C. Glembotsky et al.
Low α2b1 has been described in ANKRD26-related thrombocytopenia (RT),29 which shares several features with FPD/AML. However, whereas we confirmed that reduced α2 was restricted to some but not all ANKRD26- RT patients (Online Supplementary Figure S5), all FPD/AML patients studied showed this defect. Interestingly, α2 defi-
ciency was recently reported in two other FPD/AML pedi- grees.30,31 Study of a larger cohort is required to determine whether low α2 is a constant feature of FPD/AML and could be useful as a screening tool in this setting.
Consistent with the essential role of α2b1 in platelet interaction with monomeric collagen I,22,32 patient platelet
ABC
DE
FG
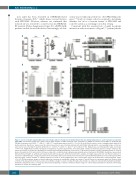
Figure 5. Levels of integrin subunit alpha (α)-2 and collagen adhesion in platelets in familial platelet disorder with predisposition to acute myelogenous leukemia (FPD/AML). (A) Real-time polymerase chain reaction (PCR) analysis of ITGA2 transcript levels normalized to GAPDH in patients from pedigree D harboring the T219Rfs*8 mutation (n=3): DII-1 ( !), DIII-1 ( !), DIII-3 ( !), and healthy subjects (n=10); **P<0.01. (B) (Left) Platelet surface levels of integrin subunit alpha (α)-2 by flow cytometry. Results are expressed as the ratio between fluorescence intensity obtained with anti-CD49b antibody and the corresponding isotype control (rel-
!!!
ative fluorescence intensity) for patients (n=4): DII-1 ( ), DIII-1 ( !), DIII-3 ( ), AII-1 ( ) and controls (n=15). Median values and interquartile range are shown;
***P<0.001. (Right) Representative histograms of integrin α2 in patient (dashed line) and control (thick continuous black line) platelets. Isotype controls in the patient and control are shown by superimposed solid gray and empty gray histograms, respectively. (C) Western blot analysis of platelet integrin subunit α2. Platelet lysates from patients (n=3) and controls (n=4) were subjected to sodium dodecyl sulphate-polyacrylamide gel electrophoresis (SDS-PAGE); membranes were probed with anti-human integrin α2 antibody and reprobed with anti-beta (b)-actin. (Bottom) Densitometric analysis of integrin α2/b-actin ratio. (D) Platelet adhesion to monomeric and fibrillar type I collagen in patients (n=3: DII-1; DIII-1; DIII-3) and controls (n=5). Platelets were stained with Phalloidin-fluorescein isothiocyanate (FITC) labeled peptide, and the number of adherent platelets per field at 1000x magnification was counted. Bars represent median values and interquartile range; *P<0.05. (E) Representative images of platelet adhesion to monomeric and fibrillar collagen are shown. (F and G) Platelet accumulation under flow. Platelets from controls (n=3) and patients (n=3) were perfused over fibrillar collagen I-coated coverslips through a flow chamber at 1 dyn/cm2, labeled with phalloidin-tetramethyl- rhodamine and platelet surface coverage was determined using Image J software. (F) Representative images of control and patient platelets obtained at 400x mag- nification are shown. AU: arbitrary units.
1252
haematologica | 2019; 104(6)
(RFI)
