
Page 88 - 2019_02-Haematologica-web
P. 88
E. Onecha et al.
in those with MRD positive status determined by NGS (HR: 4.54; P=0.005). The risk of relapse was higher only in patients who were MRD positive as determined by NGS (HR: 3.76; P=0.012).
Minimal residual disease assessment by sequencing predicts overall survival and disease-free survival bet- ter than multiparameter flow cytometry or quantitative polymerase chain reaction analysis
A positive correlation was found when comparing MRD assessment by NGS versus MFC (r=0.47, P=0.005, n=75), and NGS versus qPCR (r=0.62, P<0.001, n=80) (Online Supplementary Figure S2). There were differences between positive MRD and negative MRD groups of patients test- ed by MFC, but they were not significant for either overall survival (P=0.193) or disease-free survival (P=0.117) (n=46) (Figure 4A). Similarly, differences were observed between positive MRD and negative MRD groups defined by qPCR of NPM1, although statistical significance was not reached for either overall survival (P=0.212) or disease-free survival (P=0.086) (n=46) (Figure 4B).
Discussion
We have optimized and validated a high sensitivity NGS method for the detection and quantification of NPM1, IDH1, IDH2 and FLT3-SNV mutated sequences at very low allele frequency in follow-up gDNA samples. NGS has demonstrated prognostic value for pre-treatment status in patients with AML,17 and may also be a useful tool for detecting MRD.18,19 We first studied the mutational profile of patients with AML using a customized NGS panel to ensure a high applicability (82% of patients). This approach is also a useful screening method for detecting all potential MRD markers and choosing those most rele- vant. The combination of several markers is possible and recommended to overcome limitations of MRD assess- ment due to sub-clonal heterogeneity of AML and CHIP.11 Accordingly, our method has the capacity to evaluate mul- tiple markers simultaneously and, considering that 61% of patients in our cohort had two or more genetic alterations, this approach is sufficiently robust to monitor MRD even in patients with clonal evolution.
C
D
AB
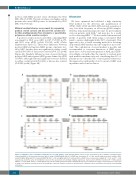
Figure 2. Calibration curve of minimal residual disease in serial dilutions. (A,B) Ten-fold dilution curves for the assessment of the sensitivity of next-generation sequencing (NGS) in (A) insertions-deletions (InDel), using OCI-AML3 gDNA with 50% NPM1 type A mutation (R2 = 0.98); and (B) single nucleotide variabts (SNV), using OCI-AML3 gDNA with 50% mutated DNMT3A (R2 = 0.98), and gDNA with 50% mutated IDH1 or IDH2 from a commercial standard (R2 = 0.91 and R2 = 0.98, respectively). (C,D) The same 10-fold dilution curves for the assessment of sensitivity of digital polymerase chain reaction (dPCR) in (C) InDel (R2 = 0.98); and (D) SNV (R2 = 0.91 for IDH1 and R2 = 0.98 for IDH2). The vertical red bars indicate the limit of quantification (LOQ) according to the sample. Clone frequency is expressed as target concentration as mutated copies/mL in wild-type copies/mL. Negative controls are included in the calibration curves and had levels below the corresponding LOQ values.
292
haematologica | 2019; 104(2)
