
Page 90 - 2019_02-Haematologica-web
P. 90
E. Onecha et al.
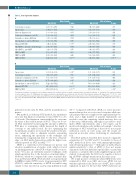
Table 2. Cox regression analyses. A.
Sex (female vs. male)
Age per year
Blasts at diagnosis (%) Leukocytes at diagnosis (×109/L) Favorable vs. adverse ELN risk Intermediate vs. adverse ELN risk Mutated FLT3-ITD
Allo-HSCT vs. intensive chemotherapy Allo-HSCT vs. auto-HSCT
MRD+ by MFC
MRD+ by qPCR
MRD+ by NGS
B.
Age per year
Sex (female vs. male) Leukocytes at diagnosis (×109/L) Favorable vs. adverse ELN risk Intermediate vs. adverse ELN risk Mutated FLT3-ITD
MRD+ by NGS
HR (95%CI)
1.20 (0.50–2.83)
1.04 (1.00–1.07) 1.00 (0.99–1.02) 1.01 (0.99–1.01) 0.67 (0.08–5.43) 1.03 (0.13–7.86) 3.45 (1.40-8.52) 1.35 (0.40–4.57) 0.29 (0.05–1.74) 2.10 (0.67–6.62) 2.51 (0.56–11.2) 4.22 (1.66–10.7)
HR (95%CI)
1.05 (1.02–1.09)
0.84 (0.33–2.17)
1.01 (0.99–1.03) 13.75 (0.84–226.1) 11.22(0.82–154.2) 8.87 (2.54–30.95) 4.54 (1.58–13.03)
Risk of death
P value
0.682
0.013 * 0.667 0.418 0.714 0.976 0.007 * 0.634 0.176 0.203 0.228 0.002 **
Risk of death
P value
0.004 *
0.720 0.219 0.067 0.071 0.001 ** 0.005 **
HR (95%CI)
0.94 (0.37–2.44)
1.03 (0.99–1.06) 1.01 (0.99–1.03) 1.00 (0.99–1.01) 0.75 (0.09–6.00) 1.02 (0.13–7.82) 2.37 (0.86–6.51) 1.78 (0.41–7.78) 0.64 (0.11–3.77) 2.40 (0.77–7.46) 5.01 (0.64–38.8) 3.41 (1.37–8.48)
HR (95%CI)
1.03 (0.99–1.07)
1.25 (0.44–3.52)
1.07 (0.99–1.02) 7.09 (0.37–134.15) 5.86 (0.39–86.84) 4.18 (1.11–15.69) 3.76 (1.34–10.54)
Risk of relapse
P value
0.906
0.069 0.532 0.508 0.786 0.988 0.095 0.44 0.629 0.130 0.123 0.008 **
Risk of relapse
P value
0.061
0.671 0.481 0.192 0.203 0.034* 0.012*
Cox regression analyses of prognostic factors influencing the risk of relapse and risk of death of patients with acute myeloid leukemia. (A) Univariate Cox regression analysis of each prognostic factor. (B) Multivariate Cox regression analysis evaluating the most relevant factors detected in the univariate analyses. HR: hazard ratio; 95% CI: 95% confi- dence interval;ITD:internal tandem duplication;ELN:European LeukemiaNet;allo-HSCT:allogeneic hematopoietic stem cell transplantation;auto-HSCT:autologous hematopoi- etic stem cell transplantation; MFC, multiparametric flow cytometry; MRD, minimal residual disease; NGS, next-generation sequencing. Statistically significant values: *P<0.05, **P<0.01.
generated erroneously by NGS, and the quantification is precise.
Our method, as with any NGS method, has an intrinsic error rate that limits its sensitivity for most SNV to 1–2% of all reads. This limitation can nevertheless be overcome by virtue of the scalable nature of NGS.16 Thus, we boost- ed NGS sensitivity by increasing the amount of DNA by PCR prior to sequencing, which increased the depth of coverage to one million reads. By also optimizing the bioinformatic analysis, we focused the search for the pre- cise variant in order to eliminate random sequencing errors, enhancing the specificity of the technique and reducing the computational time. To the best of knowl- edge, our NGS method presents possibly the highest sen- sitivity reported for NGS in AML.18,19,24-27
dPCR is a relatively novel technique for precise and absolute quantification of nucleic acids, which is based on limiting partitions of the PCR volume and Poisson sta- tistics.28 It is also an extremely sensitive technique, with a high specificity due to the detection of mutant alleles.29 However, when we compared the same standard dilu- tions in NGS and dPCR, NGS afforded a 2-log increment in LOQ for indels (NPM1) and a 1-log increment for SNV (IDH1/2), with the sensitivity of dPCR for indels being similar to that reported in a previously published study
(10-2).30 Compared with NGS, dPCR is a faster measure- ment technique but, as it is focused, it requires allele-spe- cific primers that can complicate the experimental proce- dure, and a high number of parallel experiments are needed to raise the sensitivity, which increases the cost of the assay. Additionally, although it is possible to mul- tiplex dPCR, unfortunately only a few targets can be monitored simultaneously within each sample.29 Another advantage of NGS technology is that it does not require calibration curves in each assay, and the results are reported in absolute values, facilitating its standardiza- tion.
The NGS method described here showed comparable sensitivities (10-4 for SNV and 10-5 for indels) to those of MFC methods in those cases with immunophenotyphi- cally aberrant populations.10,31 Although our method had a similar sensitivity to that of qPCR, it does not require oligonucleotides that hybridize specifically to a particular sequence, so all nucleotides in the amplified region can be studied. Consequently, the NGS test is capable of detect- ing all NPM1 subtype mutations in the same assay.
We found positive correlations when MRD levels were evaluated by NGS versus MFC and versus qPCR, but not with the expected results. In the case of MFC, this could be explained, in part, by the fact that NPM1 mutations are
294
haematologica | 2019; 104(2)
