
Page 86 - 2019_02-Haematologica-web
P. 86
E. Onecha et al.
(61%) cases and no variants in 26 (14%) cases. In addition, we detected the NPM1 type A mutation in 53 (28%) patients by qPCR. Genes (TET2, ASXL1, or DNMT3A) with evidence of an association with clonal hematopoiesis of indeterminate potential (CHIP) were excluded from the analysis.11 Consequently, 82% of patients in our cohort could benefit from this approach.
Based on those genes reported as potential markers for monitoring MRD,16 and also the availability of follow-up samples, we focused on IDH1/2 and FLT3-SNV. We iden- tified at diagnosis IDH1 mutations in 13 patients (7%), IDH2 mutations in 27 patients (14%) and FLT3-SNV mutations (18%) in 34 patients.
Deep sequencing minimal residual disease assessment has a sensitivity of 10-4 for single nucleotide variants and 10-5 for insertions-deletions
To establish the limit of quantification (LOQ) of the method, we used 10-fold serial dilutions of mixed mutat- ed and control DNA. To study prototype indels, we used gDNA from OCI-AML3 cells (NPM1 type A) and to study prototype SNV, we used both gDNA from OCI-AML3 cells (DNMT3A) and commercial reference gDNA (IDH1/IDH2). As a control, we used a pool of gDNA from ten individuals without somatic mutations in these chro- mosomal regions. In all cases, initial allele frequency was 50% and a total of six dilutions were tested to construct a calibration curve, covering a theoretical dynamic range from 10-1 to 10-7.
As shown in Figure 2A,B, MRD NGS testing of NPM1 (indel) could quantify one mutated cell in the order of 10-5 normal ones and in the case of SNV (IDH1, IDH2 and DNMT3A) the LOQ was 10-4, which was reproducible for all SNV tested.
Next-generation sequencing is more sensitive than digital polymerase chain reaction analysis for minimal residual disease assessment
We compared the sensitivity of the sequencing method with that of dPCR using the same LOQ dilution protocol. Clone frequency expressed as target concentration (mutat- ed copies/mL in wt copies/mL) gradually decreased with each dilution, reaching a LOQ of 10-3 for NPM1, IDH1 and IDH2 (Figure 2C,D). While both methods showed similar detection limits and good linearity, the LOQ for the sequencing method was one order of magnitude higher than that for dPCR (IDH1 and IDH2), and two orders of magnitude higher for indels (NMP1).
Minimal residual disease status assessed by sequencing has prognosis value in acute myeloid leukemia
The median depth coverage was 401,300 aligned reads (interquartile range 195,100–825,700) for the 88 NPM1 and 18 SNV (9 IDH1, 7 IDH2, and 2 FLT3) follow-up samples evaluated. We detected no mutated sequence in 13 (12%) samples, one to five mutated sequences in 19 (18%) sam- ples, and more than ten in 74 (70%) samples. The ratio of mutated sequences to wt sequences defined MRD levels. Considering MRD levels from the 106 samples evaluated we established the optimal cutoff to classify MRD status (positive versus negative) by receiver operating characteristic curves (Online Supplementary Figure S1) at each check-point of MRD evaluation [post-induction (n=51), post-consolida- tion (n=55), or both together (n=106)].
Survival analysis revealed that positive MRD status (MRD levels >0.1%) after induction (n=35) was associat- ed with a significantly lower rate of overall survival [33% versus 78%; hazard ratio (HR): 3.5; 95% confidence interval (CI): 1.1–10.7; P=0.019], but a non-significant lower rate of disease-free survival (58% versus 78%; HR: 2.18; 95% CI: 0.63–7.5; P=0.208) (Figure 3A,B). In post- consolidation samples (n=28), MRD positive status
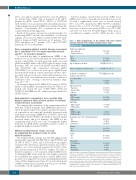
Table 1. Main characteristics of the patients with acute myeloid leukemia included in the minimal residual disease study.
Patients (n = 63)
Follow-up sample type Bone marrow Peripheral blood
Sex Male Female
Age at diagnosis, median
Blasts at diagnosis, median count
Leukocytes at diagnosis median count (×109/L)
Secondary AML No
Yes
Cytogenetic risk Favorable Intermediate Adverse
FLT3-ITD
FLT3 negative FLT3 positive
FLT3-TKD FLT3 negative FLT3 positive
NPM1
NPM1 negative NPM1 positive
Hematopoietic stem cell transplantation No
Allogeneic Autologous
Relapse No
Yes
Death No Yes
Treatment* 3+7 regimen Flugaza Mylotarg Panobidara
58 (92%) 5 (8%)
21 (33%)
42 (67%)
54 (IQR, 41.5–66.0)
69 (IQR, 51.0–81.0)
15.7 (IQR,12.2–20.24)
59 (94%)
4 (6%)
25 (40%) 36 (57%) 2 (3%)
49 (78%)
14 (22%)
60 (95%) 3 (5%)
6 (10%)
57 (90%)
42 (67%) 7 (11%) 14 (22%)
42 (67%)
21 (33%)
40 (63%) 23 (37%)
50 (80%) 8 (13%) 2 (3%) 3 (4%)
AML: acute myeloid leukemia; ITD: internal tandem duplications; TKD: tyrosine kinase domain; *3+7 regimen of chemotherapy: one or two induction cycles of cytarabine and idarubicin for 7 and 3 days, respectively; and two or three consolidation cycles of high doses of cytarabine, twice a day for 3 alternate days followed by allogeneic or autologous hematopoietic stem cell transplantation. The remainder of the patients were included in other clinical trials (Mylotarg, NTC0104104; Flugaza, NCT02319135; Panobidara,NCT00840346).Clinical data were collected in the following Spanish AML epidemiological registries: NCT01700413, NCT02006004, NCT00464217, NCT02607059, NCT01041040 and NCT01296178.
290
haematologica | 2019; 104(2)
