
Page 87 - 2019_02-Haematologica-web
P. 87
Deep sequencing method for MRD monitoring in AML
(MRD levels >0.025%) was associated with both signifi- cantly shorter overall survival (33% versus 81%; HR: 6.0; 95% CI: 1.3–28.7; P<0.001) and significantly shorter dis- ease-free survival (17% versus 94%; HR: 19.6; 95% CI: 2.5–155.6; P<0.001) (Figure 3C,D). Survival outcomes were also analyzed combining post-induction and post- consolidation (n=63) tests, in order to compare survival analysis with MFC and qPCR data sets. We observed that positive MRD status (MRD levels >0.035%) was associated with a higher risk of relapse (48% versus 81%; HR: 3.4; 95% CI: 1.4–8.5; P=0.005) and death (37% ver- sus 81%; HR: 4.2; 95% CI: 1.6–10.7; P<0.001) (Figure 3E,F). In order to test the power of NPM1 and SNV as independent predictive markers, we performed the analysis separately. Evaluating NPM1 as an MRD marker (n=54), we found that MRD positive status was associat- ed with both significantly shorter overall survival (43% versus 78%; HR: 3.3; 95% CI: 1.2–8.8; P=0.011), and
shorter disease-free survival (57% versus 85%; HR: 2.9; 95% CI: 0.9–7.6; P=0.052). Similar results were found when we evaluated IDH1, IDH2 or FLT3-SNV as MRD markers (n=11). Accordingly, MRD positive status was associated with both significantly shorter overall survival (17% versus 100%; HR: not applicable; P=0.041), and shorter disease-free survival (17% versus 75%; HR: 6.3; 95% CI:0.7–54; P=0.058).
In univariate Cox analysis (Table 2A), the risk of death was significantly higher with increasing age (HR: 1.04; P=0.013), in patients with FLT3-ITD (HR: 3.45; P=0.007), and in those with MRD positive status as determined by NGS (HR: 4.22; P=0.002). The risk of relapse was signifi- cantly higher only in those patients with MRD positive status determined by NGS (HR: 3.4; P=0.008). In multi- variate analysis (Table 2B), the risk of death was signifi- cantly higher with increasing age (HR: 1.05; P=0.004), in patients with mutated FLT3-ITD (HR: 8.87; P=0.001), and
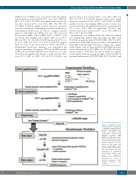
Figure 1. Workflow of the next-geneartion sequencing – minimal residual disease method. DNA amplification, library preparation and sequencing experimental workflow. Genomic DNA (gDNA) is amplified by quanti- tative (q) polymerase chain reaction (PCR) using specific primers. Libraries are pre- pared in four steps: end repair, adaptor ligation, size selection, and PCR amplifica- tion. The libraries are then sequenced. A customized bioinformatic pipeline ana- lyzes the sequences obtained. The results are expressed as a ratio of mutated sequences (mut) among wild-type (wt) sequences.
haematologica | 2019; 104(2)
291
