
Page 49 - 2019_02-Haematologica-web
P. 49
Rheb1 regulates HSC proliferation & differentiation
and development (Figure 6B). The analysis also suggests that Rheb1Δ/Δ HSCs adopt a transcriptional program similar to AML cells due to loss of Rheb1.
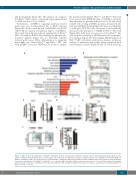
Furthermore, mTORC1 signaling pathway-related genes were also down-regulated due to Rheb1 deletion (Figure 6B). S6 ribosomal protein (Ser240/244) and 4E-BP1 (Thr37/46) are typical downstream targets of mTORC1. We found that p-S6 was reduced significantly in Rheb1Δ/Δ LKS+ cells while p-4E-BP1 did not change by phosphoryla- tion-flow analysis (Figure 6C). To determine whether reduced p-S6 causes HSCs differentiation to immature neutrophils, we cultured Rheb1fl/fl and Rheb1Δ/Δ LKS+ cells with mTORC1 activator 3BDO in CFC assays to analyze
the myeloid development. Rheb1fl/fl and Rheb1Δ/Δ BM cells were treated with 3BDO (60 nM) or DMSO for 30 min, then analyzed for phosphorylation level of S6 and sorted for LKS+ cells seeding in M3231 medium. As expected, the p-S6 level in Rheb1-deficient BM cells was lower than that of wild-type (WT) BM cells. However, it was markedly increased with treatment of 3BDO in Rheb1Δ/Δ BM cells (Figure 6D). p-S6 level was also restored in Rheb1Δ/Δ Lin– cells with the treatment of 3BDO measured by phospho- flow analysis (Figure 6E). Interestingly, 3BDO addition in Rheb1Δ/Δ LKS+ cell culture resulted in a decrease in the per- centage of immature neutrophils when compared with non-treatment controls (Figure 6F and G). These data sug-
AB
CDE
FG
Figure 6. 3BDO restores the maturation of Rheb1Δ/Δ neutrophils. (A) Gene ontology (GO) enrichment analysis of genes down-regulated and up-regulated in the absence of Rheb1. (B) Enrichment plots of selected gene sets using Gene Set Enrichment analysis. (C) Relative fluorescence intensity of p-S6 and p-4E-BP1 in Rheb1fl/fl and Rheb1Δ/Δ LKS+; n=3. (D) Protein level of p-S6 in Rheb1fl/fl and Rheb1Δ/Δ BM cells after 3BDO (60 nM) or DMSO treatment for 30 minutes (min). (E) Relative fluorescence intensity of p-S6 in Rheb1fl/fl and Rheb1Δ/Δ Lin– cells after 3BDO (60 nM) or DMSO treatment for 30 min; n=3. (F and G) FACS analysis of neutrophils and percentage of immature neutrophils in CFC assay after 3BDO (60 nM) or DMSO treatment for six days; n=3. Data are presented as mean±Standard Error of Mean. *P<0.05; **P<0.01.
haematologica | 2019; 104(2)
253
