
Page 119 - 2019_02-Haematologica-web
P. 119
ASNase hypersensitivities are IgG/IgE dependent
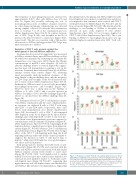
The frequency of macrophages/monocytes increased by approximately 5-10% after each ASNase dose (2 h and Day 14; Figure 3A), possibly reflecting the role of macrophages/monocytes on ASNase clearance; however, no other change in immune cell phenotype was detected among samples collected 2 h after the first sensitization dose or on Days 7 or 14 of the sensitization protocol (Online Supplementary Figure S5A-D). In contrast, frequen- cies of CD4+ Tregs, B cells, and basophils in the blood increased by Day 23 relative to naïve mice (Figure 3B-D, respectively). The data are consistent with a Th2-mediat- ed response to ASNase and suggest that CD4+ Tregs may limit sensitization to ASNase.
Depletion of CD4+ T cells protects against the development of the anti-ASNase antibodies
An immediate drop in rectal temperature was measured in ASNase sensitized mice upon ASNase challenge on Day 24, which was quantified by estimating the area under the temperature versus time curve (AUC, Figure 4A). Plasma concentrations of mMCP-1 were elevated ~10 fold 2 h after the challenge relative to controls (Figure 4B), suggest- ing that mast cell degranulation is playing a role in the reactions. Sensitized mice had much lower blood ASNase enzyme activity than controls (Figure 4C), indicating rapid, presumably antibody-mediated clearance of the drug. Similar to the pre-challenge data, only the frequency of CD4+ Tregs and basophils of the blood increased rela- tive to naïve controls (Online Supplementary Figure S6A-H). Furthermore, ASNase bound ex vivo to B cells, neutrophils, macrophages/monocytes and basophils (Figure 4D). However, there was a sharp drop in the binding of ASNase to B cells (~25%) and a modest increase in ASNase+ basophils (~10%) after the challenge (Figure 4D) relative to one day before the ASNase challenge (Day 23; Figure 1B).
To determine if B-cell or CD4+ T-cell depletion can pre- vent ASNase sensitization and the onset of hypersensitiv- ity reactions, we depleted B cells or CD4+ T cells using anti-CD19 or anti-CD4 mAb, respectively, three days before each immunization dose (Online Supplementary Figure S3B). Less than 5% of B or CD4+ T cells remained after depletion in the blood (Figure 5A-B). Upon ASNase challenge, mice with depleted B or CD4+ T cells were pro- tected from severe hypersensitivity reactions compared to sensitized mice with no immune cell depletion (Figure 5C; Online Supplementary Figure S7; P<0.01). Surprisingly, B-cell depletion did not completely protect mice from hypersen- sitivity (Figure 5C, P<0.05), whereas CD4+ T-cell depletion provided full protection (Figure 5C, P>0.05). The stronger effect of the CD4+ T cell-depleting mAb than the B-cell depleting mAb may reflect the ability of anti-CD4 mAb to suppress the function of CD4+ T cells that it fails to deplete,27 while anti-CD19 mAb has a less global suppres- sive effect on B-cell function.28
Both groups failed to develop detectable levels of anti- ASNase IgG (Figure 5D, P>0.05), and consistent with the lower anti-ASNase antibodies measured, both had similar ASNase enzyme activity levels relative to naïve mice (Figure 5E, P>0.05). CD4+ T-cell depletion led to similar mMCP-1 levels as naïve mice, whereas mice depleted of B cells had elevated mMCP-1 relative to both naïve and T cell-depleted mice (Figure 5F, P<1x10⁻⁴), suggesting that hypersensitivity in B cell-depleted mice was mediated by anti-ASNase IgE and mast cell degranulation. Supporting
this interpretation, the plasma anti-ASNase IgE levels after B-cell depletion were similar to sensitized mice and elevat- ed compared to non-sensitized, naïve controls and CD4+ T cell-depleted mice by ELISA (Figure 5G, P<1x10⁻³) and by flow cytometry (Figure 5H, P<1x10⁻⁴). On Day 24 after the challenge, ex vivo binding of ASNase to basophils was detected in mice with depleted B cells (Online Supplementary Figure S8A), but not in mice depleted of CD4+ T cells (Online Supplementary Figure S8B). The ex vivo binding of ASNase to macrophages/monocytes was sig- nificantly higher in sensitized mice after CD4+ T-cell or B-
A
B
C
D
Figure 3. Frequencies of CD4+ Tregs, B cells, and basophils increase in blood after ASNase sensitization. The frequency of (A) macrophages/monocytes, (B)
+
CD4 Tregcells,(C)Bcells,and(D)basophilswasmeasuredinthebloodofmice
at various time points during sensitization. A total of 5 or 10 mice were included in each analysis, as indicated, and P value significance is indicated as * for P<0.05, ** for P<0.01, *** for P<1x10⁻³, and **** for P<1x10⁻⁴.
haematologica | 2019; 104(2)
323
