
Page 97 - 2018_12-Haematologica-web
P. 97
MYC inhibits miR-150 expression in CML
MYC repressed expression of miR-150 in CML cells
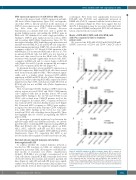
Based on the inverse trend of MYC expression and miR- 150 levels (Online Supplementary Figure S1C), we hypothe- sized that MYC is directly involved in the repression of MIR150 gene expression in CML. Publicly available ChIP- Seq data from the UCSC Genome Browser (http://genome.ucsc.edu/index.html) were used to predict the protein binding regions surrounding the MIR150 gene in K562 cells. We identified loci with a high probability of binding to MIR150 gene regulatory factors such as MYC and its partner MAX (Online Supplementary Figure S5). We investigated whether MYC binds these regions in naive and imatinib-treated K562, KCL-22 and HL-60 cells using chro- matin immunoprecipitation (ChIP). We observed the MYC occupancy at the loci -11.7 kb and -0.35 kb upstream of the MIR150 gene TSS in untreated K562 and at the loci -11.7 kb in untreated KCL-22 cells, but MYC was not detected at these and other tested loci in the HL-60 cells. The 48-h treatment with imatinib significantly decreased the MYC occupancy in K562 cells and, to a lesser degree, in KCL-22 cells (Figure 4A and B), but the treatment did not impact MYC non-occupancy in HL-60 cells (Figure 4C).
To determine the effect of profound MYC suppression on miR-150 expression, K562 and KCL-22 cells were treated with bromodomain inhibitor JQ1.23 JQ1 treatment signifi- cantly, and to a similar extent, decreased MYC mRNA expression in K562 and KCL-22 cells (Online Supplementary Figure S6A), without affecting BCR-ABL1 expression (Online Supplementary Figure S6B), and increased miR-150 levels in KCL-22 cells but not in K562 cells (Online Supplementary Figure S6C).
Next, we investigated MYC binding to MIR150 gene reg- ulatory regions in sorted CD34+ and CD34– CML primary cells compared with that in healthy donors. We found marked MYC binding to the -11.7 kb and -0.35 kb loci in CD34+ cells isolated from CML-CP patients (n=3) at the time of diagnosis. In contrast, MYC occupancy at these loci was weak in CD34+ cells from healthy donors (n=3) (Figure 5A). Decreased MYC occupancy to MIR150 gene regulato- ry regions was detected in the leukemic CD34– subpopula- tion, while MYC binding in the tested loci was unde- tectable in CD34– cells of healthy donors (Figure 5B). These data highlight the role of MYC in regulating the MIR150 gene in CML.
To investigate a potential regulatory loop between the miR-150 target MYB and different molecules, we investi- gated the effect of silencing MYB expression using siRNA in K562 and KCL-22 cells. No significant effects on BCR- ABL1, MYC, miR-150, miR-155 and PU.1 levels were observed following near complete MYB inhibition (Online Supplementary Figure S7), suggesting that MYB is not involved in the direct regulation of these molecules in CML.
Resistant chronic myeloid leukemia cells further down-regulate miR-150
To address whether the studied leukemic network is involved in TKI resistance in CML, we analyzed gene expression in resistant CML cells using two established dis- tinct models of resistance (see Online Supplementary Methods). BCR-ABL1 was strongly over-expressed in all CML cell cultures. Similar BCR-ABL1 transcript levels were observed between the resistant and sensitive parental cell lines (Figure 6). miR-150 and miR-155 levels were signifi- cantly lower (P<0.001) in both resistant CML cell lines com- pared with the levels in their respective imatinib-sensitive
counterparts. PU.1 levels were significantly decreased in KCL-22R cells (P<0.001) and significantly increased in K562R cells (P<0.01) compared with the levels in their sen- sitive counterparts (Figure 6). These data suggest that fur- ther PU.1 deregulation may be associated with the block- ade of erythroid (K562) and myeloid (KCL-22) cell differen- tiation, respectively, in resistant CML.
Model of BCR-ABL1/MYC/miR-150/MYB/miR- 155/PU.1 regulatory links in leukemic
primary cells
We assessed the BCR-ABL1/MYC/miR-150/MYB/miR- 155/PU.1 network of CD34+ and CD34– CML-CP cells at
Figure 4. miR-150 regulation by MYC in leukemic blasts. MYC occupancy at putative regulatory loci of the MIR150 gene in (A) K562, (B) KCL-22 and (C) HL- 60 cells with or without imatinib treatment. Columns represent the fold change (FC) in the % of DNA input obtained in the control (gray) or imatinib-treated (dark) cells compared with the non-specific IgG precipitation and equalized to 1 (dashed line). The promoter region of the miR-15a/16-1 cluster was used as the positive control of MYC DNA binding. Unpaired two-tailed Student t-test was used to determine P-values. *P<0.05, **P<0.01. Error bars represent standard devi- ations.
A
B
C
haematologica | 2018; 103(12)
2021
