
Page 96 - 2018_12-Haematologica-web
P. 96
K. Srtutova et al.
upon the BCR-ABL1 inhibition induced by imatinib in the K562 cells. Thus, BCR-ABL1 inhibits miR-150 transcription without affecting miR-150 maturation (Figure 3H).
The inhibition of BCR-ABL1 using imatinib significantly increased the G0/G1 phase and decreased the S phase in K562 cells, which was accompanied by an increase in apoptosis (Online Supplementary Figure S4). Sensitivity to imatinib differed significantly between cell lines, as 50% of the K562 cells but only 5% of the KCL-22 cells under- went apoptosis 96 hours (h) after imatinib treatment
(Online Supplementary Figure S4B and D). This difference in imatinib sensitivity had been previously discovered during the development of the resistant cell lines (see Online Supplementary Appendix) and is consistent with the ability of KCL-22 cells to continuously grow in the presence of 1 mM imatinib and relapse early due to the acquisition of resistant BCR-ABL1 mutations or to BCR-ABL1-indepen- dent mechanisms.22 Restoration of miR-150 had no impact on the cell cycle or viability in the K562 cells with- in 96 h post transfection (Online Supplementary Figure S4).
AB
CD
EF
G
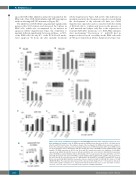
Figure 3. The effects of miR-150 overexpression and BCR-ABL1 silencing on the expression of genes in onco- H genic pathways in leukemic cells. (A) MYB transcript and MYB protein expression in HL-60 cells 48 hours (h) after the miR-150 transfection. The numbers shown at the top indicate the MYB protein expression relative to that in the untreated samples (β-actin normalized). Expression of MYB transcripts (48 h) and c-MYB protein (96 h) in (B) KCL-22 and (C) K562 after miR-150 transfection and/or BCR-ABL1 activity inhibition with 1 mM imatinib. (D) MYB expression in K562 cells 48 h miR-150 transfection and/or the inhibition of BCR-ABL1 expression by siRNA. (E) miR-155 levels in KCL-22 and K562 cells 96 h after 30 nM miR-150 transfection and/or BCR-ABL1 activity inhibition with 1 mM imatinib. (F) PU.1 expression in KCL-22 and K562 cells 96 h after miR-150 transfection and/or BCR-ABL1 activity inhibition with 1 mM imatinib. (G) MYC expression in KCL- 22, K562 and HL-60 cells after exposure to 1 mM imatinib. (H) Pri-miR150, pre-miR150 and miR-150 levels in K562 cells upon BCR-ABL1 inhibition. Generally, cells were transfected with 30 nM miR-150 mimic or 50 nM siRNA BCR-ABL1. The expression data represent the expression fold change (FC; 2-ΔΔCt) in relation to untreated, control (Ctrl) sample normalized to 1. Unpaired two-tailed Student t-test was used to determine P-values.
*P<0.05, **P<0.01, and ***P<0.001. Error bars represent standard deviations.
2020
haematologica | 2018; 103(12)
