
Page 95 - 2018_12-Haematologica-web
P. 95
MYC inhibits miR-150 expression in CML
miR-150 expression is likely regulated by BCR-ABL1 activity (Online Supplementary Figure S2).
We tested this hypothesis by overexpressing miR-150 (Online Supplementary Figure S3) and inhibiting BCR-ABL1 in CML cells. Imatinib (the most frequently used TKI in CML treatment) and/or BCR-ABL1-specific siRNA were used to determine the effect of the BCR-ABL1 activity/expression inhibition.
First, miR-150 overexpression significantly decreased MYB mRNA and protein expression levels in both the BCR-ABL1-positive (K562) and BCR-ABL1-negative (HL- 60) cells. MYB protein levels were decreased in KCL-22 cells (Figure 3A-C); the expression of c-MYB (75 KDa) was inhibited in both CML cell lines, while the expression of the spliced 37-KDa MYB variant was affected in HL-60 cells (the 75-KDa MYB variant was not expressed in these cells). MYB expression was down-regulated after the inhi- bition of BCR-ABL1 activity and expression in the CML cells (Figure 3B-D). Furthermore, simultaneously restoring miR-150 and inhibiting BCR-ABL1 had a positive combi- nation effect on the inhibition of MYB mRNA levels (Highest Single Agent approach value: CI_HSA 0.9654) in
the K562 cells and protein levels in the K562 and KCL-22 cells (Figure 3B and C). There were no significant differ- ences between the effects of imatinib alone or its combi- nation with a miR-150 mimic with regard to the inhibition of MYB expression. Interestingly, miR-155 levels were sig- nificantly increased in both K562 and KCL-22 cells after the suppression of BCR-ABL1 activity by imatinib (Figure 3E). The inhibition of BCR-ABL1 activity also significantly decreased PU.1 in K562 cells but significantly increased PU.1 in KCL-22 cells (Figure 3F). This finding is of interest, as K562 cells represent leukemic erythroblasts, whose proper differentiation requires low PU.1 levels, while KCL-22 cells represent leukemic myeloblasts, whose dif- ferentiation requires high PU.1 levels.
Next, we found that suppressing BCR-ABL1 activity by imatinib significantly decreased MYC mRNA expression in K562 and KCL-22 cells, while imatinib had no impact on MYC expression in the BCR-ABL1-negative HL-60 cells (Figure 3G). We investigated the possible inhibitory role of BCR-ABL1 and its putative downstream target MYC in miR-150 expression and maturation. The levels of the miR- 150 precursors and mature miR-150 consistently increased
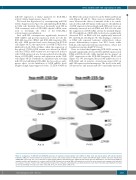
P=0.16 P=0.22
P=0.14 P=0.45
Figure 2. Comparison of miR-150 and miR-155 expression in leukemic stem/progenitor cells (LSPCs) in blast crisis and chronic phase (CP) chronic myeloid leukemia (CML). Pie charts illustrate the proportions of read count median values for miR-150 (left column) and miR-155 (right column) expression obtained by miRNA RNA sequencing. The read counts that overlapped with miR-150 and miR-155 after alignment with human genome GRCh38 were calculated using miRDeep quantifier module and normalized to counts per million (CPM). Primary bone marrow (BM) cell populations used for the measurement and comparison are indicated for each pair of charts. P-values in the miR expression between the compared cell populations are illustrated below each chart. Paired two-tailed Student t-test was used for determining of P-values. BC: blast crisis CML (n=3); CP: chronic phase CML (n=3).
haematologica | 2018; 103(12)
2019
