
Page 94 - 2018_12-Haematologica-web
P. 94
K. Srtutova et al.
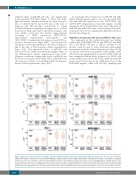
validated target of miR-155 in B cells,15 was significantly down-regulated (P<0.0001) (Figure 1). These data high- light the notable similarity between the expression pro- files of CML-CP CD34+ and CD34– cells at the time of diagnosis and TKI resistance, respectively. To obtain detailed information regarding the expression of studied molecules in CML cells, CD34+ and CD34– leukemic cells were further sorted into five distinct subpopulations according to CD38 expression: CD34+CD38–; CD34+CD38+; CD34–CD38+; CD34–CD38+low; and CD34–CD38–. A marked gradual increase in miR-150 lev- els and a decrease in its target MYB11 were found both among the sorted subpopulations at the time of diagnosis and at the time of TKI resistance (Online Supplementary Figure S1A). The increased levels of miR-150 and decreased levels of MYB coincided with a higher degree of cell differentiation (Online Supplementary Figure S1B). Negative correlations between the levels of miR-150 and the levels of oncogenes (BCR-ABL1, MYC and MYB) were observed across all five sorted leukemic BM cell subpopu- lations (Online Supplementary Figure S1C).
To investigate the potential roles of miR-150 and miR- 155 in different disease phases, we also measured miR- 150 and miR-155 expression in the CD34+CD38– and CD34+CD38+ subpopulations from BM samples of CML patients in CP (n=3) and in blast crisis (n=3). The levels of miR-150 and miR-155 in the corresponding cell popula- tions in the CP were not significantly different from those in blast crisis (Figure 2).
BCR-ABL1 deregulated miR-150 and MYB in CML cells
The expression of the studied molecules was further evaluated in CML (K562, KCL-22 and MEG-01) and AML (KG-1 and HL-60) cell lines to address whether in vitro models could be used to study functional relationships between the molecules (Online Supplementary Figure S2). In accordance with data from primary CML samples, miR- 150 levels were significantly decreased in CD34– CML cell lines compared with the levels in the pool of CD34– cells from healthy donors (n=10) (P<0.001), while the miR-150 levels were 5-fold lower in the CML than those in the BCR-ABL1-negative AML cells (P<0.01), implying that
A
B
CD
E
F
Figure 1. Expression of genes involved in a putative oncogenic pathway in primary chronic myeloid leukemia (CML) and healthy cells. The expression of MYC (A), miR-150 (B), MYB (C), miR-155 (D), PU.1 (E) and BCR-ABL1 (F) in CD34+ (left) and CD34– (right) subpopulations from CML-chronic phase (CP) patients at diagnosis (n=28) or at the time of resistance to tyrosine kinase inhibitors (TKIs) (n=18) compared to that in the CD34+ or CD34– subpopulations of healthy donors (n=10). Gene expression in each specific sample is indicated by dots; the boxes represent box-and-whisker plots. Red: bone marrow (BM) CML-CP samples; black: healthy peripheral blood mononuclear cells (PBMC); blue lines: median expression values. Significant differences (P-values) in the gene expression between CML and healthy CD34+ and CD34– subpopulations are illustrated in the tables below each box-and-whisker plot. Unpaired two-tailed Student t-test was used to determine P-values.
2018
haematologica | 2018; 103(12)
