
Page 99 - 2018_12-Haematologica-web
P. 99
MYC inhibits miR-150 expression in CML
talized human B-cell model; however, the tested mecha- nism of direct MYC binding to the regulatory loci of the MIR150 gene was not confirmed.28 In the present study, we identified previously untested loci -11.7 kb and -0.35 kb upstream of the MIR150 TSS that were occupied by MYC in CD34+ and CD34– CML-CP primary cells. The occupancy of MYC at both loci was found in K562 and, in the case of the -11.7 kb locus, in KCL-22 cells but not in BCR-ABL1-negative HL-60 cells. Inhibiting BCR-ABL1 activity with imatinib decreased MYC expression and depleted MYC occupancy at these specific loci in the K562
and KCL-22 cells. In contrast, imatinib treatment had no impact on either MYC expression or its occupancy on the studied MIR150 loci in the HL-60 cells. A pronounced decrease in MYC expression was observed without an impact on BCR-ABL1 activity using JQ1, which signifi- cantly increased miR-150 levels in KCL-22 but not K562 cells. This finding may be explained by the assumption that a profound inhibition of both MYC and BCR-ABL1 is required to induce miR-150 expression in K562 cells.
Moreover, we tested dual MYC regulatory mechanisms of MIR150 expression, including direct transcriptional acti-
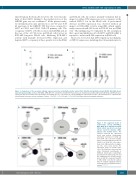
AB
Figure 6. Comparison of the oncogenic pathway expression profiles in imatinib-sensitive (naive) K562, KCL-22 and imatinib-resistant K562R, KCL-22R chronic myeloid leukemia (CML) cell lines. BCR-ABL1, MYB, MYC, PU.1, miR-150 and miR-155 transcript levels in (A) KCL-22 and KCL-22R and in (B) K562 and K562R. Gene expression data for resistant cells represent the fold change (FC; 2-ΔΔCt) in relation to corresponding gene expression for naive cells normalized to 1. Unpaired two- tailed Student t-test was used to determine P-values. *P<0.05, ** P<0.01, and ***P<0.001. Error bars represent standard deviations.
AB
CD
–
and CD34 (B) cells from healthy
Figure 7. The suggested model of relationships among BCR-ABL1, MYC, MYB, PU.1, miR-150 and miR- 155 in CD34+ and CD34– cells from chronic myeloid leukemia (CML) patients and healthy donors. The schemes represent the expression levels and mutual relationships among the molecules in CD34+ (A)
donors compared with the profiles of CD34+ (C) or CD34– (D) cells, respec- tively, from CML patients at diagno- sis. The circle sizes denote the expression levels of specific mole- cules. The black lines represent the active stimulatory (arrowheads) or inhibitory (flat-heads) relationships described in the manuscript. The red line emphasizes the novelty mecha- nism of miR-150 repression by MYC in CML CD34+ cells. By the dashed lines we outlined regulations that we
assumed based on published obser- vations.15,17,18,24,25,27
haematologica | 2018; 103(12)
2023
