
Page 78 - 2018_12-Haematologica-web
P. 78
P.L. Moura et al.
A
B
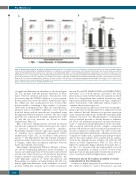
Figure 4. Blebbistatin treatment abrogates circulation-induced differences in reticulocyte cross-sectional area. (A) Automated Rheoscope and Cell Analyzer (ARCA) contour plots demonstrating the probability distribution of erythrocytes, uncirculated reticulocytes and circulated reticulocytes with cross-sectional area plotted against deformability index. Reticulocytes were untreated, treated with blebbistatin(-) or treated with blebbistatin(+) as displayed in each column. Cell types are plot- ted pairwise for ease of visualization. The probability density functions for the data were generated through kernel-density estimation of three pooled samples per group. (B) Comparison of the area difference to red blood cells between untreated, blebbistatin(-)-treated and blebbistatin(+)-treated cells that were left in culture (gray) or were circulated overnight (white). *Indicates a P-value of under 0.05, with n.s.s. (not statistically significant) indicating P-values above 0.05. P-values for rel- evant comparisons are shown underneath the graph. All comparisons were made with a paired two-tailed t-test between arrays of area difference to red blood cells. Data are represented as mean ± standard deviation (n=3).
of significant differences in abundance is shown in Figure 1D. The proteins with the greatest difference in abun- dance between cultured and native reticulocytes were processed using the STRING database to create protein- protein interaction networks (Online Supplementary Figure S2), which ease data visualization. It was observed that protein families containing a large number of proteins skewed the resulting networks. Thus, ribosomal proteins, initiation factors and tRNA synthetases were removed from the dataset and the network was re-analyzed using the Ingenuity Pathway Analysis software. The top scoring networks are summarized in Online Supplementary Table S2 and the top four networks are shown in Online Supplementary Figure S3.
One of the most striking features observed in cultured reticulocytes compared to native reticulocytes was a glob- al increased abundance of metabolic enzymes. Particularly, enzymes related to glycolysis and processing of ornithine were significantly upregulated (Online Supplementary Figure S4), in accordance with previous reports.23,24 We hypothesize that the nutrient abundance present in culture media may cause the observed metabol- ic changes, rather than an inherent difference between native and cultured reticulocytes.
Interestingly, the Ingenuity Pathway Analysis software also showed underlying differences in the abundance of various cytoskeletal proteins between native and cultured reticulocytes. Since the process of reticulocyte maturation requires extensive remodeling of the cytoskeleton,5 the Gene Ontology category of ‘Actin Cytoskeleton and Remodeling’ was further scrutinized (Figure 1E). We con- firmed significant differences in the abundance of several proteins within this category, most notably non-muscle
myosin IIA and IIB (NMIIA/MYH9 and NMIIB/MYH10) and talin-1. Loss of both myosin7 and talin-121 has been previously associated with reticulocyte maturation, which leads us to hypothesize that cultured reticulocytes may represent an intermediate maturational stage compared to native reticulocytes, with additional stimuli required to complete the maturation process.
Post-translational modification of proteins via phospho- rylation provides an additional level of regulation beyond that achieved through differences in protein expression and is of particular importance within the transcriptionally deficient red blood cell. Phosphorylation of membrane and cytoskeletal proteins is already known to influence red blood cell membrane properties and protein interac- tions7,25-27 and increased phosphorylation of the cytoskele- tally-associated junctional protein complex component protein 4.1R has previously been reported in murine retic- ulocytes compared to erythrocytes.7 In order to assess the protein phosphorylation landscape of human reticulocytes compared to erythrocytes, qualitative phosphoproteomics data for the same samples were acquired and are summa- rized in the diagram shown in Figure 1F, with the full dataset in Online Supplementary Table S3. The table in Figure 1G summarizes high-confidence data (false discov- ery rate = 1%, proteins with one single peptide across all samples disregarded), in which it can be observed that many proteins are phosphorylated exclusively in reticulo- cytes, consistent with their higher kinase activity.28
Non-muscle myosin IIA localizes proximally to vesicle compartments in the reticulocyte
As the most highly upregulated cytoskeletal proteins in the cultured compared to native reticulocytes, myosins
2002
haematologica | 2018; 103(12)
