
Page 76 - 2018_12-Haematologica-web
P. 76
P.L. Moura et al.
ple was kept in culture without circulation. For drug treatment to test NMIIA inhibition, cells were exposed during circulation to either 20 mM blebbistatin(-) (Insight Biotechnology), or 20 mM blebbistatin(+) (Source BioScience) as a negative control.
Results
Quantitative proteomics data analysis reveals differences between erythrocytes, native reticulocytes and cultured reticulocytes
In order to explore possible changes in protein abun- dance and function underlying reticulocyte maturation, we produced a TMT-based quantitative proteomics dataset and a qualitative phosphoproteomics dataset com- paring donor-matched native reticulocytes, cultured retic- ulocytes and erythrocytes. The CD71+ population (native reticulocytes) was isolated through magnetic bead isola- tion. While this strategy does not distinguish between subsets of reticulocytes as compared to alternative fluores- cence activated cell sorting-based methods,6 it does pro- vide a convenient method to obtain the required number of cells from each separate donor for biochemical analysis. The CD71- population (erythrocytes) was collected from the flow-through of the CD71+ cell isolation, and CD34+ precursors were isolated, expanded and differentiated to generate in vitro-derived (cultured) reticulocytes. The design of this experiment is summarized in Figure 1A. All samples submitted to proteomics were characterized regarding established reticulocyte markers (Online
Supplementary Figure S1). Data resulting from the experi- ment are presented in Online Supplementary Table S1.
These proteomic datasets were analyzed with the objective of determining possible targets for further study of reticulocyte maturation. First, a broad comparison of protein expression changes between reticulocytes and ery- throcytes was performed. In accordance with previous lit- erature, where a loss of protein content is expected in mat- uration,20,21 both native and cultured reticulocytes have a higher abundance of most proteins, as shown in Figure 1B. However, protein clusters where expression is higher in the erythrocyte can also be observed and were found to encompass both contaminating material (serum proteins and keratins) and functional proteins (e.g. carbonic anhy- drase 1/2/3). Only six proteins were significantly increased (average log2 fold-change >1) in the erythrocyte population, and all corresponded to contamination except for carbonic anhydrase 1. This observation reflects the fact that residual protein synthesis still takes place in the retic- ulocyte by means of the ribosomes and RNA present in the cell, and carbonic anhydrase 1 in particular is known to be synthesized during maturation.22 Some inter-sample variation was observed between the same cell types, like- ly due to variable purity in the CD71 isolation protocol (Online Supplementary Figure S1). Furthermore, the hetero- geneous nature of reticulocyte populations undergoing maturation creates inherent difficulties for comparative proteomics. Nonetheless, native and in vitro-derived (cul- tured) reticulocytes were found to exhibit a very similar global protein expression profile (Figure 1C). A summary
AB
C
DE
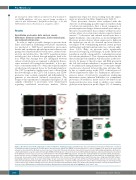
Figure 2. Non-muscle myosin IIA components localize proximally to autophagic vesicles. (A) Erythrocytes (top) and cultured reticulocytes (bottom) were co-labeled for phospho-non-muscle myosin IIA (S1943) (green) and non-muscle myosin IIA (NMIIA) (red) and subjected to confocal imaging. Cells were fixed, labeled and cytospun as described in the Methods section. Scale bars: 10 mm. (B) Untreated reticulocytes (top) and reticulocytes treated with lambda phosphatase (bottom) for a dephosphorylation assay were labeled for phospho-NMIIA (S1943) (green). Cells were fixed, treated with lambda phosphatase, labeled and cytospun as described in the Methods section. Scale bars: 10 mm. (C) Western blot of the phospho-NMIIA signal before and after the dephosphorylation assay with lambda phosphatase. Protein 4.2 was used as a loading control. (D) Cultured reticulocytes were co-labeled with phospho-NMIIA (S1943) (green) and LC3B (red), and imaged by confocal microscopy. A zoomed-in section is shown to facilitate identification of the structures. Three-dimensional reconstruction was done using arivis Vision4D software, maximizing contrast for clarity. Scale bar in initial image: 10 mm. Scale bar in zoomed-in image: 5 mm. (E) Fixed and permeabilized cultured reticulocytes were dual- labeled for phosphorylated myosin light chain (red) and phosphatidylserine or trypsin sensitive glycophorin A epitope R10 as indicated (green) and imaged using confocal microscopy. For R10 staining, reticulocytes were previously treated with trypsin. Images are shown in two-dimensional phase overlay, two-dimensional flu- orescence, three-dimensional reconstructions and three-dimensional reconstructions with zoom highlighted. Scale bars: 5 mm.
2000
haematologica | 2018; 103(12)
