
Page 75 - 2018_12-Haematologica-web
P. 75
NMII participates in reticulocyte maturation
ABC
DE
F
G
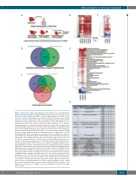
Figure 1. Reticulocyte culture and maturation lead to differences in phosphorylation status and protein abundance. (A) Experimental design for proteomic comparison – red blood cells, native reticulocytes (CD71+ cells) and hematopoietic precursors (CD34+ cells) were separated with magnetic bead isolation. Cultured reticulocytes were leukofil- tered after 21 days of culture post-CD34+ cell isolation. (B) Heatmap visualization of the tandem mass tag (TMT) proteome dataset generated from log2 fold-change values of expression in native and cultured reticulocytes with erythrocytes as a baseline. Individual samples are visualized as separate rows. Blue denotes lower expression, and red denotes higher expression. Proteins were clustered through the average link method and a corresponding dendrogram was generated, shown to the left of the heatmap (n. of proteins analyzed: 2140; false discovery rate = 5%). (C) Heatmap visualization of TMT proteome dataset generated from log2 fold-change values of expression in cultured reticulocytes with native reticulocytes as a baseline. The processing was the same as that for Figure 1B. (D) Venn diagram of differentially expressed proteins (absolute log2 fold-change >1) in endogenous and cultured reticulocytes using red blood cells as a baseline for comparison. A total of 1667 proteins were differentially expressed in retic- ulocytes. (E) Heatmap visualization of the “Actin Cytoskeleton and Remodeling” Gene Ontology category present in the TMT proteome dataset, comparing cultured reticulo- cytes with native reticulocytes as the baseline. The processing was the same as that for Figure 1B. (F) Venn diagram of the phosphorylated proteins detected through qualitative phosphoproteomics comparison of red blood cells, native reticulocytes (NatRet) and cul- tured reticulocytes (CultRet). The dataset was filtered at a 5% false discovery rate for this analysis, with no further constraints. A total of 521 phosphoproteins were detected. (G) High-confidence peptides (false discovery rate = 1%) detected through qualitative phosphoproteomics. The table was filtered to include only peptides which were present in at least two samples in the same condition. The ID column denotes the UniProt pro- tein identities. Common protein names and protein symbols (GN) are defined in the Protein column. The phosphorylation site of the respective peptides is in the column Site and was acquired through comparison with the PhosphoSitePlus® database.53 The number of occurrences per condition of each phosphorylation is written in the right- most columns.
haematologica | 2018; 103(12)
1999
