
Page 77 - 2018_12-Haematologica-web
P. 77
NMII participates in reticulocyte maturation
ABC
DE
FG
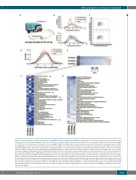
Figure 3. In vitro circulation of cultured reticulocytes recapitulates aspects of reticulocyte maturation. (A) Diagram of the circulation system used to study the impact of shear stress on reticulocyte maturation. Cells are subjected to a continuous difference in pressure with the use of a peristaltic pump, and are circulated overnight at 37oC in 5% CO2. A matched control is kept in culture overnight, without circulation. (B) Cross-sectional area profile of red blood cells, reticulocytes kept in culture overnight without circulation (Ctrl), and reticulocytes circulated overnight (Circ). The profile is plotted as the average of the proportion of cells within each area “bin” (corresponding to 5 mm2). Error bars correspond to the standard deviation of each average. Data were obtained using an Automated Rheoscope and Cell Analyzer (ARCA). (C) ARCA contour plots demonstrating the probability distribution of erythrocytes, uncirculated reticulocytes and circulated reticulocytes with cross-sectional area plotted against deformability index. The probability density functions for the data were generated through kernel-density estimation of three pooled samples per group. (D) Deformability index (length/width ratio) profile of red blood cells, uncirculated reticulocytes and circulated reticulocytes. The profile is plotted as the aver- age of the proportion of cells within each deformability index “bin” (corresponding to 0.1 ratio units). Error bars correspond to the standard deviation of each average. Data were obtained using the ARCA. (E) Heatmap visualization of the tandem mass tag (TMT) proteome dataset generated from log2 fold-change values of expression in circulated reticulocytes with uncirculated reticulocytes as a baseline. Individual samples were visualized as separate rows. Blue denotes lower expression, and red denotes higher expression. Proteins are displayed horizontally by order of average log2 fold-change (n. of proteins analyzed: 2447). (F) Subset of Figure 3D detailing the 40 proteins with the lowest log2 fold-change, or, alternatively, the 40 proteins in which abundance is reduced to the greatest degree in circulated reticulocytes. Mitochondrial proteins are indicated with red arrows. (G) Subset of Figure 3D detailing erythroid proteins of interest. Proteins are displayed vertically by order of aver- age log2 fold-change.
haematologica | 2018; 103(12)
2001
