
Page 80 - 2018_12-Haematologica-web
P. 80
P.L. Moura et al.
ABC
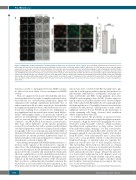
Figure 5. Blebbistatin treatment abrogates circulation-induced differences in reticulocyte vesicle content. (A) Permeabilized trypsin-treated reticulocytes were probed with R10 (pseudo-colored green) and protein disulfide isomerase (PDI), calreticulin, giantin, LAMP-1, Mitotracker or LC3B (pseudo-colored red) and imaged using confocal microscopy. Scale bars: 5 mm. (B) Example of the machine detection algorithm used for quantitative imaging of cells containing mitochondria (Online Supplementary Methods). Images were obtained using confocal imaging. The top row shows the individual channels corresponding to Calcein Blue (pseudo-colored red) and Mitotracker (pseudo-colored green), and an overlay of the channels. In the bottom row machine detection of the Calcein Blue signal is shown through yellow borders surrounding detected cells, machine detection of the Mitotracker signal is shown with red borders surrounding detected mitochondria, and cells containing mitochondria are shown with yellow borders in the overlay column. Scale bars: 10 mm. (C) Comparison of the reduction in the proportion of cells with mitochondria after circulation using automated counting, in both untreated reticulocytes and blebbistatin(-)-treated reticulocytes. Data are represented as mean ± standard devi- ation (n=3).
bistatin is unable to distinguish between NMII isoforms, its effect is far more likely to have an impact on NMIIA activity.
Thus, we analyzed reticulocyte deformability and circu- lation-mediated area loss after overnight circulation concur- rent with the use of blebbistatin enantiomers. Figure 4A summarizes the multiple experiments performed. Use of either enantiomer did not affect reticulocyte deformability in a significant manner; however, the reduction in cross-sec- tional area resulting from circulation was diminished to non-significant levels in reticulocytes treated with blebbis- tatin(-). Interestingly, Smith et al. previously reported an increase in deformability of blebbistatin-treated erythro- cytes as assessed through use of a microfluidic device37 in contrast to our ARCA-based observations on reticulocytes. This may reflect differences in the specific parameters assessed by each method as well as variances in the intrinsic cytoskeletal properties of the two cell types. Paired compar- ison graphs of the cross-sectional area and deformability of untreated, blebbistatin(-)-treated and blebbistatin(+)-treated reticulocytes are shown in Online Supplementary Figure S7. Statistical analysis of the data with pairwise comparisons of relevant pairs is shown in Figure 4B.
After having determined that NMIIA inhibition leads to a decrease in the capacity of the reticulocyte to respond to shear stress, the underlying mechanism causing this differ- ence was investigated. As the quantitative proteomics com- parison between circulated and uncirculated reticulocytes showed a significant loss of mitochondrial proteins follow- ing circulation, we decided to characterize the impact of cir- culation on the mitochondrial content of the reticulocyte. First, in order to confirm that mitochondrial content in the reticulocyte is associated with vesicular localization (as has been previously described4), permeabilized, trypsin-treated
reticulocytes were co-labeled with R10 (an antibody to gly- cophorin A with trypsin-sensitive epitope) and markers for mitochondria (Mitotracker), endoplasmic reticulum pro- teins (calreticulin and PDI), Golgi (giantin), lysosomes (LAMP-1) and autophagosomes (LC3B). Vesicles with con- tents positive for all of these markers were observed (Figure 5A). Cells stained with PDI antibody were manually quan- tified through the use of Vision4D software before and after circulation for the presence of PDI-positive vesicles, with a significant decrease (3-fold, P<0.05) in the percentage of vesicle-containing cells being observed after circulation (Online Supplementary Figure S8).
To further explore the possibility of increased vesicle clearance upon circulation in a high-throughput quantita- tive manner, a high-resolution live-imaging protocol was developed using Vision4D software, which facilitates algorithm-based segmentation in large planes created from individual image stitching.38 For this, reticulocytes were co-labeled with Calcein Blue AMTM and the live cell imaging-compatible mitochondrial marker Mitotracker Deep Red FMTM, both cell-permeable dyes. Calcein Blue was used to avoid problems related to edge detection in bright-field images, as internal edges are typically dis- played in reticulocytes due to their irregular structure. The Calcein Blue-labeled cell was then used as a binary image mask for the detection of internal mitochondria. Figure 5B shows the algorithm’s method with a represen- tative immunofluorescence image. Despite the presence of a fluorescent background in both channels used, our method is able to successfully identify cells in the image, mitochondria in the cells, and recognize cells that contain mitochondria. Automated image processing in this way also avoids user-created bias.
Having developed this protocol, circulated reticulocytes
2004
haematologica | 2018; 103(12)
