
Page 168 - 2018_12-Haematologica-web
P. 168
M.A. Dimopoulos et al.
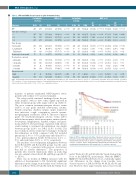
Table 2. ORR and MRD disease based on prior treatment history.
# of patients ORR, n (%) a # of patients MRD, n (%)
in group in group
10–5
Subgroup D-Rd Rd D-Rd Rd Pc D-Rd Rd D-Rd Rd Pd D-Rd Rd Pd
10–6
ITTb
Prior lines of therapy
1 2-3 1-3
Prior therapy Bortezomib Lenalidomide
281 276
147 142 120 115 267 257
237 232 50 47 119 123 57 56
143 131 138 145 98 92 183 184
27 36
132 111
261 (92.9)
137 (93.2) 114 (95.0) 251 (94.0)
218 (92.0) 42 (84.0) 109 (91.6) 50 (87.7)
129 (90.2) 132 (95.7) 87 (88.8) 174 (95.1)
23 (85.2)
125 (94.7)
211 (76.4)
114 (80.3) 85 (73.9) 199 (77.4)
175 (75.4) 32 (64.0) 87 (70.7) 38 (67.9)
87 (66.4) 124 (85.5) 57 (62.0) 154 (83.7)
24 (66.7)
91 (82.0)
<0.0001
0.0003 <0.0001 <0.0001
<0.0001 0.0233 <0.0001 0.0113
<0.0001 0.0038 <0.0001 0.0004
0.0435
0.0004
286 283
149 146 123 118 272 264
241 238 50 50 122 125 59 58
146 134 140 149 99 95 187 188
28 37
133 113
75 (26.2)
38 (25.5) 34 (27.6) 72 (26.5)
63 (26.1) 13 (26.0) 26 (21.3) 12 (20.3)
34 (23.3) 41 (29.3) 21 (21.2) 54 (28.9)
6 (21.4)
42 (31.6)
18 (6.4)
12 (8.2) 5 (4.2) 17 (6.4)
18 (7.6) 2 (4.0) 6 (4.8) 4 (6.9)
7 (5.2) 11 (7.4) 6 (6.3) 12 (6.4)
0 (0)
13 (11.5)
<0.000001
0.000053 <0.000001 <0.0001
<0.000001 0.0012 <0.0001 0.0308
<0.0001 <0.0001 0.0021 <0.0001
0.0009
0.0001
37 (12.9)
15 (10.1) 20 (16.3) 35 (12.9)
32 (13.3) 7 (14.0) 16 (13.1) 6 (10.2)
16 (11.0) 21 (15.0) 8 (8.1) 29 (15.5)
4 (14.3)
20 (15.0)
8 (2.8)
7 (4.8) 1 (0.8) 8 (3.0)
8 (3.4) 2 (4.0) 2 (1.6) 2 (3.4)
2 (1.5) 6 (4.0) 2 (2.1) 6 (3.2)
0 (0)
6 (5.3)
0.000003
0.081340 0.000003 <0.0001
0.000051 0.0729 0.0002 0.1410
0.0006 0.0010 0.0514 <0.0001
0.0078
0.0109
Thalidomide Refractory to bortezomib Treatment-free interval
≤12 months >12 months ≤6 months >6 months
Cytogenetic riske
Highf
Standard
D-Rd: daratumumab/lenalidomide/dexamethasone; Rd: lenalidomide/dexamethasone; ITT: intent-to-treat. Data are based on computerized algorithm. aResponse-evaluable population. bITT population. cP value was generated using the Cochran-Mantel-Haenszel χ2 test. dP value was generated using the likelihood-ratio χ2 test. eBiomarker risk-evaluable population. fIncludes subjects who have either del17p, t(14;16), t(4;14) or a combination of these.
majority of patients maintained MRD-negative status; patients will continue to be assessed annually.
The safety profile remained unchanged from the pri- mary analysis, with no new safety signals reported in either treatment group with longer follow up (Table 3). The most common treatment-emergent adverse events (≥15%) of any grade included neutropenia, anemia, thrombocytopenia, diarrhea, fatigue, upper respiratory tract infection, cough, constipation, muscle spasms, nasopharyngitis, and nausea (Table 3). The most common grade 3/4 treatment-emergent adverse events (≥5%) included neutropenia, febrile neutropenia, anemia, throm- bocytopenia, lymphopenia, diarrhea, fatigue, and pneu- monia (Table 3). The percentage of patients with adverse events leading to treatment discontinuation was similar between groups (12.0% for D-Rd, 12.8% for Rd). The most common adverse events (≥1%) leading to treatment discontinuation in D-Rd compared with Rd included pneumonia (1.4% vs. 0.7%), pulmonary embolism (0% vs. 1.1%), general physical health deterioration (1.1% vs. 0%), and renal failure (0.4% vs. 1.1%), respectively.
The incidence of second primary malignancies between the D-Rd (n=283) and Rd (n=281) groups was the same (5.7% vs. 5.7%), consistent with previous observations that had no notable differences.15 The proportion of patients who received transfusions while on study drug was also similar between the D-Rd and Rd groups (24.4% vs. 25.3%).
There was no decline in HRQoL measures with the addition of daratumumab to Rd. Statistically significant differences in the change from baseline were observed in favor of D-Rd at Weeks 48 and 56 with the Utility Score
Figure 2. PFS by cytogenetic risk status. Cytogenetic risk was assessed via next- generation sequencing. High-risk patients had any of t(4;14), t(14;16), or del17p. Standard-risk patients had an absence of high-risk abnormalities. PFS: progres- sion-free survival; D-Rd: daratumumab/lenalidomide/dexamethasone; Rd: lenalidomide/dexamethasone; HR: hazard ratio; CI: confidence interval.
and at Weeks 40, 48, and 56 with the Visual Analog Scale Score of the EQ-5D-5L questionnaire. With the EORTC QLQ-C30 Global Health Status Score, statistically signifi- cant differences in the change from baseline were observed in favor of D-Rd at Weeks 40, 48, 52, 68, 84, and 116. However, these improvements did not last beyond
2092
haematologica | 2018; 103(12)
