
Page 167 - 2018_12-Haematologica-web
P. 167
Subgroup analyses of D-Rd vs. Rd in POLLUX
A
B
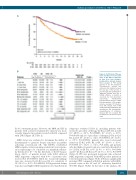
Figure 1. (A) PFS in the ITT popu- lation and (B) a forest plot sum- mary of PFS HRs in subgroups by prior lines, prior therapies, treatment-free intervals. Kaplan- Meier analysis of PFS among patients in the ITT population. aTreatment-free interval was defined as the duration between the end date of the last line of prior therapy and randomization. bHigh-risk patients had any of t(4;14), t(14;16), or del17p as assessed by next generation sequencing. cStandard-risk patients had an absence of high- risk abnormalities. PFS: progres- sion-free survival; ITT: intent-to- treat; HR: hazard ratio; D-Rd: daratumumab/lenalidomide/dex amethasone; Rd: lenalidomide/ dexamethasone; CI: confidence interval; NR: not reached; TFI: treatment-free interval; std: stan- dard.
subgroups evaluated (Table 2), including patients who received 1 prior line of therapy (D-Rd, n=149; Rd, n=146; 10–5: 25.5% vs. 8.2%; P=0.000053; 10–6: 10.1% vs. 4.8%; P=0.08134) and 2 to 3 prior lines of therapy (D-Rd, n=123; Rd, n=118; 10–5: 27.6% vs. 4.2%; P<0.000001; 10–6: 16.3% vs. 0.8%; P=0.000003), patients who were bortezomib refractory (D-Rd, n=59; Rd, n=58; 10–5: 20.3% vs. 6.9%; P=0.0308; 10–6: 10.2% vs. 3.4%; P=0.1410), and patients who had high-cytogenetic risk at a sensitivity threshold of 10–5 (D-Rd, n=28; Rd, n=37; 21.4% vs. 0.0%, P=0.0009) and 10–6 (D-Rd, n=28; Rd, n=37; 14.3% vs. 0.0%, P=0.0078 [Table 2]). PFS was prolonged in patients who achieved MRD negativity compared with MRD-positive patients in both treatment arms (Figure 3A-B). D-Rd also significantly prolonged PFS compared with Rd in patients with MRD- positive status at the 10–5 and 10–6 sensitivity thresholds (P<0.001 [Figure 3A-B]). At the time of the analysis, the
No. of progression or Median progression-free
death events/total no.
survival (months)
51.4%) treatment groups. However, the ORR and PFS in patients with a shorter treatment-free interval was more severely impacted in patients treated with Rd compared with D-Rd (Figure 1B, Table 2).
MRD status was evaluated to determine the ability of daratumumab to generate deeper responses in patients achieving conventional CR. The IMWG established MRD-negative criteria requiring evaluation by next-gener- ation sequencing to be conducted at a minimum sensitiv- ity threshold of 10–5.23 At this threshold, of the ITT popu- lation, 26.2% of patients treated with D-Rd achieved MRD negativity compared with 6.4% of patients who received Rd (P<0.000001 [Table 2]). Consistent findings were also observed for D-Rd versus Rd at a sensitivity of 10–6 (12.9% vs. 2.8%; P=0.000003). D-Rd generated deeper responses and higher MRD-negativity rates than Rd in all
haematologica | 2018; 103(12)
2091
