
Page 166 - 2018_12-Haematologica-web
P. 166
M.A. Dimopoulos et al.
Additional details on assessments for safety, MRD, cytogenetic risk, and HRQoL and statistical analyses are provided in the Appendix.
Results
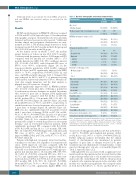
Of 569 enrolled patients in POLLUX, 286 were assigned to D-Rd and 283 to Rd (Appendix Figure 1). Baseline patient demographics and prior treatment history were generally balanced and have been previously reported.15 Additional baseline clinical and cytogenetic characteristics are sum- marized in Table 1. The median (range) duration of study treatment was 24.5 (0-32.7) months in the D-Rd group and 16.0 (0.20-32.2) months in the Rd group.
At the clinical cut-off on March 7, 2017, the median (range) duration of follow up was 25.4 (0-32.7) months. Consistent with the primary analysis, D-Rd improved PFS compared with Rd (median not reached [NR] vs. 17.5 months; hazard ratio [HR], 0.41; 95% confidence interval [CI], 0.31-0.53; P<0.0001), with 24-month PFS rates of 68.0% versus 40.9%, respectively (Figure 1A). In the response-evaluable population, D-Rd (n=281) compared with Rd alone (n=276) significantly improved the ORR (92.9% vs. 76.4%, respectively; P<0.0001 [Table 2]), and rates of ≥VGPR and ≥CR (Appendix Table 1). Stringent CRs were achieved by 26.0% and 8.7% of patients receiving D-Rd and Rd, respectively (Appendix Table 1). Overall sur- vival data remain immature, and the final analysis is planned after 330 events are observed.
D-Rd significantly improved PFS in RRMM patients who received several prior lines of therapy, a population for whom more effective therapies are needed. In patients who received 1 prior line of therapy, D-Rd significantly prolonged PFS compared with Rd (D-Rd, n=149; Rd, n=146; median NR vs. 19.6 months; HR, 0.39; 95% CI, 0.26-0.58, P<0.0001 [Figure 1B, Appendix Figure 2A]), with 24-month PFS rates of 70.3% and 45.0%, respectively. A similar benefit was observed in patients who received 2 to 3 prior lines of therapy (Figure 1B, Appendix Figure 2B). ORR was also significantly improved in patients treated with 1 prior line of therapy (D-Rd, n=147; Rd, n=142; 93.2% vs. 80.3%; P=0.0003 [Table 2]) and 2 to 3 prior lines of therapy (D-Rd, n=120; Rd, n=115; 95.0% vs. 73.9%; P<0.0001 [Table 2]). It is considered preferable for MM patients who relapse to switch drug classes for subsequent therapy,22 and, in bortezomib-refractory patients, D-Rd significantly prolonged PFS compared with Rd (D-Rd, n=59; Rd, n=58; median 26.1 vs. 11.3 months; HR, 0.46; 95% CI, 0.26-0.80; P=0.0051 [Figure 1B]), with 24-month PFS rates of 60.0% and 29.7%, respectively, and improved ORR (D-Rd, n=57; Rd, n=56; 87.7% vs. 67.9%; P=0.0113 [Table 2]).
Patients with high-risk cytogenetic status have had his- torically poor outcomes, but, regardless of cytogenetic risk status, D-Rd improved outcomes compared with Rd (Figures 1B and 2, Table 2). PFS was longer for D-Rd-treat- ed (n=28) versus Rd-treated patients (n=37) with high cyto- genetic risk (median 22.6 vs. 10.2 months; HR, 0.53; 95% CI, 0.25-1.13; P=0.0921; 24-month PFS rate, 48.1% vs. 31.7%), and significantly longer for patients with stan- dard-risk disease (D-Rd, n=133; Rd, n=113; median NR vs. 18.5 months; HR, 0.30; 95% CI, 0.20-0.47; P<0.0001; 24-month PFS rate, 74.3% vs. 40.0% [Figures 1B and 2]). With D-Rd versus Rd, significantly higher ORRs were
Table 1. Baseline demographic and clinical characteristics.
Characteristic
Age, years Median (range)
Median (range) time from diagnosis, years
ECOG performance-status, n (%) 0
1
2
Cytogenetic profile, n (%)a
n
Standard risk High risk
t(4;14) t(14;16) del17p
Prior lines of therapy, n (%) Median (range)
1
2to3
Time since last prior line of therapy, n (%)
>12 months ≤12 months >6 months ≤6 months
Prior ASCT, n (%)
Prior PI, n (%)
Bortezomib Prior IMiD, n (%)
Lenalidomide
Thalidomide
Prior IMiD + PI, n (%)
Refractory to bortezomib, n (%) Refractory to last line of therapy, n (%)
D-Rd (n=286)
65 (34-89)
3.48
(0.4-27.0)
139 (48.6) 136 (47.6) 11 (3.8)
161 133 (82.6) 28 (17.4) 16 (9.9) 1 (0.6) 13 (8.1)
1 (1-11) 149 (52.1) 123 (43.0)
140 (49.0)
146 (51.0)
187 (65.4)
99 (34.6)
180 (62.9)
245 (85.7)
241 (84.3)
158 (55.2)
50 (17.5)
122 (42.7)
125 (43.7)
59 (20.6)
80 (28.0)
Rd (n=283)
65 (42-87)
3.95
(0.4-21.7)
150 (53.0) 118 (41.7) 15 (5.3)
150 113 (75.3) 37 (24.7) 21 (14.0) 3 (2.0) 13 (8.7)
1 (1-8) 146 (51.6) 118 (41.7)
149 (52.7)
134 (47.3)
188 (66.4)
95 (33.6)
180 (63.6)
242 (85.5)
238 (84.1)
156 (55.1)
50 (17.7)
125 (44.2)
125 (44.2)
58 (20.5)
76 (26.9)
D-Rd: daratumumab/lenalidomide/dexamethasone; Rd: lenalidomide/dexametha- sone; ECOG: Eastern Cooperative Oncology Group; ASCT: autologous stem cell trans- plantation; PI: proteasome inhibitor; IMiD: immunomodulatory drug. aCentral next-generation sequencing. High-risk patients had any of t(4;14), t(14;16), or del17p. Standard-risk patients had an absence of high-risk abnormalities.
observed for both high-risk (D-Rd, n=27; Rd, n=36; 85.2% vs. 66.7%; P=0.0435) and standard-risk patients (D-Rd, n=132; Rd, n = 111; 94.7% vs. 82.0%; P=0.0004 [Table 2]). Further subgroup analyses determined that the clinical benefit of daratumumab was maintained in patients regardless of prior lines of therapy received (1-3), prior treatment exposure (thalidomide or lenalidomide), or time since last therapy (≤12, >12, ≤6, or >6 months [Figure 1B, Table 2, Appendix Figure 2C]).
Although D-Rd was associated with a significant treat- ment benefit in subpopulations that received their last line of prior therapy either ≤12 or >12 months before random- ization into the study (Figure 1B, Table 2), the proportion of patients who remained progression-free and alive at 24 months was smaller among patients who relapsed earlier in both the D-Rd (63.6% vs. 72.4%) and Rd (29.2% vs.
2090
haematologica | 2018; 103(12)
