
Page 169 - 2018_12-Haematologica-web
P. 169
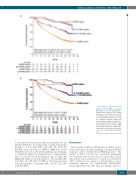
Subgroup analyses of D-Rd vs. Rd in POLLUX
A
B
Figure 3. PFS by MRD at sensitivity threshold of (A) 10–5 and (B) 10–6. Kaplan-Meier estimates of PFS among patients in the intent-to-treat popula- tion. MRD-negative status was evaluat- ed at sensitivity thresholds of 10–5 and 10–6 using bone marrow aspirate sam- ples that were prepared using Ficoll and analyzed by the clonoSEQTM assay. PFS: progression-free survival; MRD: minimal residual disease; D-Rd: dara- tumumab/lenalidomide/dexametha- sone; Rd: lenalidomide/dexametha- sone.
3 consecutive assessments in either questionnaire. No sig- nificant differences for median time to improvement (6.6 months vs. 6.5 months; HR, 1.03; 95% CI, 0.81-1.30; P=0.820) were reported for EORTC QLQ-C30 Global Health Status Scores in the D-Rd and Rd groups. Similarly, no significant differences in median time to improvement were observed between treatment groups for either the EQ-5D-5L Utility Score (6.6 months vs. 10.2 months; HR, 1.23; 95% CI, 0.97-1.57; P=0.089) or Visual Analog Scale Score (6.9 months vs. 9.3 months; HR, 1.14; 95% CI, 0.89- 1.45; P=0.283).
Discussion
These updated analyses with nearly one further year of follow up reinforce the initial findings of deep and durable responses achieved with D-Rd in RRMM patients.15 The benefit of D-Rd over Rd was consistently maintained across patients who received 1 or 2 to 3 prior lines of ther- apy, and the risk of progression or death was reduced by >60%. D-Rd was also superior to Rd regardless of prior treatment exposure (i.e., lenalidomide, thalidomide, bortezomib-refractory), time since last therapy, and cyto-
haematologica | 2018; 103(12)
2093
