
Page 88 - 2018_11-Haematologica-web
P. 88
A.C. Fassoni et al.
process resulting from the interplay between tumor growth, activation/deactivation of LSCs, and cytotoxic TKI action (Figure 1A, and see Methods). In brief, the model describes three LC types: quiescent LSC (X), prolif- erating LSC (Y) and fully differentiated LCs (W). The acti- vation of dormant LSCs and deactivation of proliferating LSCs are described by rate constants 𝑝𝑋𝑌 and 𝑝𝑌X while LSCs proliferate with a rate constant 𝑝𝑌. During therapy, we assume a cytotoxic TKI effect on proliferating LSCs,
described by the rate constant 𝑒𝑇𝐾𝐼>0.
We obtain an exact solution for the model, in which the
patient-specific response can be expressed in terms of the mechanistic model parameters [equation (SE5) in Online Supplementary Text S2]. In other words, a patient’s bi-pha- sic BCR-ABL1 decline characterized by the slopes a, β is expressed in terms of the resulting net cytotoxic effect 𝑞=𝑒𝑇𝐾𝐼−𝑝𝑌 (difference between TKI toxicity and LSC prolif- eration) and the effects of LSC activation/deactivation 𝑝𝑋𝑌
A
B
CD
EF
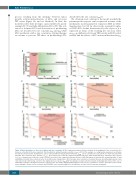
Figure 2. Model predictions on dose de-escalation and dose escalation. (A) The long-term treatment efficiency, defined as the magnitude of the second slope 𝛽, is
shown as a function of the dose reduction. The threshold for optimal favorable reduction, 𝑓
1C) indicates how much the standard dose can be reduced without losing treatment efficiency. 𝑓
can be calculated for each patient (see main text). Any other
favorable dose reductions (dose fraction 𝑓>𝑓
, green region) also retain the long-term treatment efficiency, while unfavorable dose reductions (dose fraction
𝑓<𝑓
, red region) are predicted to lead to a severe decrease in the long-term treatment efficiency. (B-E) Simulations of favorable (B), optimal favorable (C) and
𝑂𝑃𝑇
𝑂𝑃𝑇
unfavorable (D and E) dose reductions after 36 months under standard dose. After favorable dose reductions, a transient increase in proliferating leukemic stem
cells (LSCs) (red) is followed by a return to the original decrease rate 𝛽≈−𝑝 , while the dynamics of quiescent LSCs remains unchanged (blue lines). In the case of
𝑋𝑌
unfavorable reduction, an impaired scenario is observed. See also Online Supplementary Figures S3-S6. (F) dose escalation to 𝑓=200% after three years of treat-
ment; although a deeper level is reached in the BCR-ABL1 levels of proliferating LSCs, the dynamics of quiescent LSCs remains unchanged.
𝑂𝑃𝑇
(≈25% in this example, i.e. using median parameters as in Figure
𝑂𝑃𝑇
1828
haematologica | 2018; 103(11)
