
Page 89 - 2018_11-Haematologica-web
P. 89
TKI dose reduction in CML
and 𝑝𝑌𝑋. Taking into account the intrinsic scaling between the mechanistic parameters (Figure 1B), which indicates that LSC deactivation, activation, and depletion by TKI occur at different time scales, those expressions for 𝛼 and 𝛽 can be further simplified, allowing us to dissect the prominent processes governing each treatment phase (Figure 1C and D, Online Supplementary Texts S5-S7 and Online Supplementary Figure S2).
We found that slope 𝛼 can be expressed as 𝛼≈−𝑞=𝑝𝑌−𝑒𝑇𝐾𝐼, thereby confirming that the initial treat- ment phase is dominated by the cytotoxic TKI effect on proliferating LSCs, which leads to a rapid reduction in BCR-ABL1 levels. Dose-escalation studies for imatinib substantiate this result by indicating that a higher TKI dose leads to a more rapid response.23,24 Similarly, slope 𝛽 can be approximated as 𝛽≈−𝑝𝑋𝑌, implying that after deple- tion of initially abundant proliferating LSCs, the treatment response is bounded by the rare activation of quiescent LSCs. This provides a consistent explanation for the slow- er long-term decrease in proliferating and quiescent LSCs. These analytical conclusions confirm previous findings,5-7 but also allow further predictions on the effect of dose de- escalation to be made.
A wide range of reduced TKI doses is predicted to induce the same long-term response as standard dose
Due to the bounded activation of quiescent LSCs after the initial therapy response, there is a range of favorable reduced TKI doses where the long-term efficiency (defined by the magnitude of slope 𝛽) remains almost constant with the same overall efficiency as that achieved when applying the standard dose (green region in Figure 2A, and Online Supplementary Figure S3). In this case, the resulting, although reduced, cytotoxic TKI effect is still sufficient to target the abundant proliferat- ing LSCs once a patient has reached sustained remission. This range of ‘favorable’ reduced doses spans from the standard full-dose to a certain threshold, i.e. an ‘optimal favorable’ dose (green dashed line in Figure 2A), below which an accelerated decrease in long-term treatment efficiency is observed. Therefore, dose reductions below this optimal dose are considered as ‘unfavorable’ (red region in Figure 2A).
We look for a mathematical expression, which allows us to estimate this optimal dose reduction for each patient in terms of the model parameters. Although there is a mini- mal required plasma concentration for TKI cytotoxicity,
AB
CD
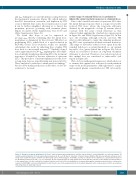
Figure 3. Step-wise treatment optimization. (A) Step 1: initial treatment with standard dose until the patient shows a clearly identifiable second slope (approx. 18 months) and determination of the bi-exponential parameters (A, B, a, β). (B) Step 2: reduction of tyrosine kinase inhibitor (TKI) dose by half and continuous moni- toring of the treatment response until the new intercept B′ can be inferred (approx. 18 months). (C) Step 3: reduction to the optimal dose calculated from values of the identified parameters (A, B, B’, a, β; see main text). (D) The long-term follow up using optimal dose shows that the response to this adaptive treatment adheres to the original slope β for the eradication of residual leukemic stem cells (LSCs) as standard dose treatment. Although the adapted treatment leads to a delay in the reduction of BCR-ABL1 levels in proliferating LSCs and, therefore also in the peripheral blood, the treatment dynamics in the residual quiescent LSCs are unaltered while drug intake is drastically reduced.
haematologica | 2018; 103(11)
1829
