
Page 87 - 2018_11-Haematologica-web
P. 87
TKI dose reduction in CML
Reimplementation of the model in a stochastic version using a Gillespie algorithm ensured that there are no distinct differences resulting from small cell numbers (Online Supplementary Text S4).
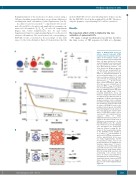
In contrast to previous models,5,17 competition between nor- mal cells and LCs is described only implicitly, by assuming con- stant total cell numbers, 𝑇𝑌, 𝑇X , 𝑇W in each cell compartment (Figure 1D, Online Supplementary Text S1 and Online Supplementary Figure S2 complementing Figure 1C on the level of absolute cell numbers). The actual tumor load, corresponding to BCR-ABL1 levels, is modeled as the percentage of LCs with respect to the total cell number. Figure 1C demonstrates that the
AB
modeled BCR-ABL1 levels of proliferating LSCs behave exactly like the BCR-ABL1 levels in the peripheral blood (PB). Therefore, only the dynamics of proliferating LSCs will be considered.
Results
The long-term effect of TKI is limited by the rare activation of quiescent LSCs
We apply a simple mathematical model that describes the time course of TKI response in CML as a dynamic
C
𝑇𝐾𝐼
D
slopes in the bi-exponential decline
Figure 1. Mathematical model for
chronic myeloid leukemia (CML)
treatment and mechanistic interpre-
tation of the bi-phasic decline. (A)
Schematic model representation with
three cell types: quiescent (𝑋, blue)
and proliferating (𝑌, red, turnover with
rate 𝑝 ) leukemic stem cells (LSCs), 𝑌
and differentiated leukemic cells
(LCs), denoted by 𝑊 (green, generat-
ed with rate 𝑝 , decaying with rate 𝑊
r ). The model assumes (i) mecha- 𝑊
nisms of activation/deactivation of
quiescent/proliferating LSCs with
rates 𝑝 and 𝑝 and (ii) a cytotoxic 𝑋𝑌 𝑌𝑋
effect of TKI on proliferating LSCs with intensity 𝑒 . (B) The mecha-
nistic model parameters [(TKI net effect (𝑞=𝑒 −𝑝 ), activation rate of
quiescent LSCs ( 𝑝 ), deactivation 𝑋𝑌
equation (SE1)
in Online
𝑇𝐾𝐼 Y
rate of proliferating LSCs (𝑝 )] were 𝑌𝑋
fitted to individual patient data from the IRIS and CML-IV trials.18,19 The resulting distributions reveal an intrinsic scaling between them, which are dispersed over different orders of magnitude. (C) Model simulation with median parameter values obtained from IRIS and CML-IV data illustrating the equivalence between tumor load (in terms of BCR-ABL1 levels) in the peripheral blood (green) and within the proliferating LSCs (red). Values on the y-axis indicate the relative abun- dance of BCR-ABL1 positive cells in each specific cell compartment [see
Supplementary Text S1], which corre-
sponds to the tumor load in terms of
PCR-based measurements of the
BCR-ABL1/ABL1 ratio. We adopted
this scheme for all corresponding fig-
ures throughout the manuscript.
Using the intrinsic scaling (B), the
of the BCR-ABL1 levels simplify to
𝛼≈−𝑞 and 𝛽≈−𝑝 . The abundance of
quiescent LSCs follows a monophasic decline approximated by 𝛽≈−𝑝 .
𝑋𝑌
See Online Supplementary Text S3
for parameter values used in all
model simulations. (D) During the ini-
tial phase (upper panel, “1st slope”),
eradication of the proliferating LSCs
(red) with effective rate q is the dom-
inating process (large black arrow).
After the strong initial reduction, few
proliferating cells remain (lower
panel, “2nd slope”) and eradication is
now limited by the activation rate 𝑝 𝑋𝑌
(small black arrow) of quiescent LSCs (blue). Normal cells are shown in gray. See also Online Supplementary Figure S2.
𝑋𝑌
haematologica | 2018; 103(11)
1827
