
Page 86 - 2018_11-Haematologica-web
P. 86
A.C. Fassoni et al.
minimize side-effects associated with continuous TKI therapy are required. While a number of studies evaluate TKI cessation, strategies to apply long-term dose reduc- tions are currently under-appreciated, although the poten- tial benefits of dose de-escalation are at hand: besides reducing treatment-related side-effects and increasing patients’ quality of life, it also reduces the treatment-relat- ed costs.11-14 The DESTINY trial (clinicaltrials.gov identifier: 01804985)15,16 is an ongoing study addressing TKI dose de- escalation. However, with its primary end point (molecu- lar relapse risk after TKI cessation preceded by a one year dose de-escalation) this trial focuses on stopping TKI, rather than on long-term outcomes under continuous but reduced TKI treatment.
Here, we describe a systematic, conceptual analysis of the impact of dose de-escalation on the long-term disease kinetics. Our simulation study relies on a mathematical description of TKI-treatment, which builds on a previous- ly published CML model.5,17 In contrast to the earlier approach, we use a simplified model which allows for a stringent analytical formulation of the disease dynamics without changing the overall qualitative system proper- ties. The model parameters are estimated from available, patient-specific BCR-ABL1 kinetics, determined within controlled clinical phase III trials [IRIS (clinicaltrials.gov iden- tifier: 0000634318), CML IV (clinicaltrials.gov identifier: 0005587419)].
Our results support the rationale for TKI dose de-escala- tion in patients who have already reached sustained remission. We provide strong evidence that the long-term depletion of residual LSCs in remission phase is not affect- ed by defined TKI-dose reduction. Furthermore, we pro- pose a strategy to determine patient-specific optimal TKI doses, and predict that dose-halving is a safe treatment option for the majority of patients in sustained molecular remission. The suggested dose optimization can con- tribute to the prevention of severe side-effects (e.g. cardio- vascular complications, pleural effusion) and to a reduc- tion of overall treatment costs.
Methods
Patient data and parametrization
The presented results are based on a secondary analysis of previously published data from the IRIS (clinicaltrials.gov identifier: 00006343)18 and CML IV (clinicaltrials.gov identifier: 00055874) tri- als.19 In particular, we used 69 patients from the German ima- tinib (400 mg) arm of the IRIS trial and 280 patients from the 400 mg imatinib monotherapy arm of the CML-IV study, for which IS corrected BCR-ABL1/ABL1 time courses were available at the time of our primary model analysis.5,17 As described in the orig- inal publications,20,21 both clinical trials were conducted in accor- dance with the Declaration of Helsinki and applicable regulatory requirements. The protocols were approved by the institutional review board or ethics committee of each participating center. All patients or guardians gave written informed consent before participation.
For each individual patient, the treatment response at time 𝑡 (𝐿𝑂𝐵𝑆(𝑡)), measured in the form 100% × BCR-ABL1/ABL1, is fur- ther described according to a biphasic characteristic, i.e.
For each patient, parameters A, B, a and β are determined using maximum likelihood estimation. For the model analysis, we selected patients with (i) sufficient time points for model fit- ting (>4) which (ii) do not show a long-term increase in BCR- ABL1/ABL1 ratio (β<0) but are characterized by (iii) a biphasic decline, (a<β<0). We also excluded 2 additional patients with measured BCR-ABL1 ratios of more than 500%, which indicates a pronounced non-linearity between BCR-ABL1 abundance and tumor load, resulting in n=55 (IRIS cohort) and n=134 (CML-IV cohort) (Online Supplementary Table S1). Median follow up of this patient cohort is 4.3 years [IQR (2.8,6.3)]; 98.4% of the patients achieved BCR-ABL1 ratio of less than 1%, while 91% achieved MR3 at least once. We also tested the robustness of our model results with respect to the reliability of high BCR-ABL1 values (Online Supplementary Table S2).
For comparisons with the DESTINY trial (clinicaltrials.gov iden- tifier: 01804985),15,16 only patients treated with TKI for at least three years and with BCR-ABL1 levels below MR3 for at least the last year of treatment were used. Therefore, we excluded from the study 53 patients treated for less than three years (excluding n=4 for IRIS; n=49 for CML-IV) and 14 patients with no MR3 in the entire last year of treatment (excluding n=4 for IRIS; n=10 for CML-IV). The time courses of the remaining 122 patients [(n=47 IRIS, median follow up 6.5 years [IQR(5.9;6.9)]; n=75 CML-IV, median follow up 4.6 years [IQR(3.9;6.1)] are available in Online Supplementary Figure S1. Following the DES- TINY trial, these patients were further split into an MR4 and an MR3 cohort, depending on whether their BCR-ABL1 levels in the last year were below MR4 or not. These selection and clas- sification procedures were based on the individual bi-exponen- tial fit 𝐿𝑂𝐵𝑆(𝑡) of each patient (also shown in Online Supplementary Figure S1).
Mathematical model
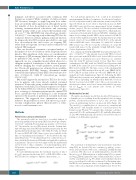
We apply a mechanistic model that describes TKI response as a dynamic process resulting from the interplay between tumor growth, activation/deactivation of LSCs, and cytotoxic TKI action on proliferating, but not on quiescent LSCs (Figure 1A). The model is a simplification of our previous computational CML model5,17 and formally related to a model proposed by Komarova and Wodarz.22 It considers three leukemic cell types: quiescent LSCs (𝑋), proliferating LSCs (𝑌), and fully differentiat- ed LCs (𝑊). Mathematically, the model is described by the fol- lowing set of differential equations:
The activation of dormant LSCs and deactivation of prolifer- ating LSCs are described by rate constants 𝑝𝑋𝑌 and 𝑝𝑌𝑋 respec- tively. LSCs proliferate with a rate constant 𝑝𝑌 . During therapy, a cytotoxic TKI effect acts on proliferating LSCs, described by the rate 𝑒𝑇𝐾𝐼>0. Differentiation of proliferating LSCs is quanti- fied by 𝑝𝑊 and the limited life-time of differentiated LCs is mod- eled by a mortality rate 𝑟𝑊. We define a net leukemia reduction 𝑞=𝑒𝑇𝐾𝐼−𝑝Y with 𝑞>0 for effective treatment. For illustrating simu- lations we used parameter values corresponding to the median values of the selected patients (Online Supplementary Text S1-S3).
1826
haematologica | 2018; 103(11)
