
Page 50 - 2018_11-Haematologica-web
P. 50
J. Lian et al.
A
B
CD
EF
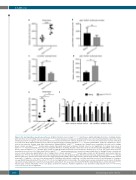
Figure 4. The alas1 mutation caused heme deficiency. (A) Whole fish heme levels of alas1smu350/smu350 mutants were significantly higher than those of siblings. Relative whole fish heme levels in siblings (circles) and alas1smu350/smu350 mutants (squares) at 4 days post fertilization (dpf). Lines show mean±Standard Deviation (SD), 6 indi- vidual data points in each group, each data point was based on 3 measurements for 5 embryos; Student t-test, ***P<0.001. The relative heme level was normalized to per-fish level. (B) No significant differences in erythrocyte numbers between siblings and alas1smu350/smu350 mutants. gata1:DsRed+ erythrocyte numbers were meas- ured by flow cytometric analysis using 4-dpf self-progeny of Tg(gata1:DsRed)+/+;alas1smu350/+ transgenic line. Numbers were normalized to per-fish level in siblings (black column) and alas1smu350/smu350 mutants (gray column). Mean±SD; performed in triplicate; Student t-test, ns: not significant. (C) Cellular heme levels of alas1smu350/smu350 mutant neutrophils were decreased compared with those of siblings. Relative cellular heme levels in sorted neutrophils (lyz:DsRed+ cells) of siblings (black column) and alas1smu350/smu350 mutants (gray column) at 4 dpf. Mean±SD; performed at least in triplicate; Student t-test, *P<0.05. The relative heme level was normalized to per-cell level. (D) Cellular heme levels of alas1smu350/smu350 mutant erythrocytes were increased compared with those of siblings. Relative cellular heme levels in sorted erythrocytes (gata1:DsRed+ cells) of siblings (black column) and alas1smu350/smu350 mutants (gray column) at 4 dpf. Mean±SD; performed in triplicate; Student t-test, *P<0.05. The relative heme level was normalized to per-cell level. (E) Aberrant whole fish heme increment was dampened in alas1smu350/smu350 mutants without erythrocytes. Relative whole fish heme levels in 4-dpf alas1;gata1a siblings, alas1 single mutants, gata1a single mutants, and alas1;gata1a double mutants from alas1smu350/+;gata1am651/+ in-cross. Lines show mean±SD, 4 individual data points in each group, each data point was based on 3 measurements for 5 embryos; one-way ANOVA followed by Dunnett T3 post test, *P<0.05. ns: not significant; nd: not detectable. The relative heme level was normalized to per-fish level. (F) Relative expressions of alas2 and genes related to heme degradation and transport. The assay was performed by RT-qPCR in 4-dpf siblings (black column) and alas1smu350/smu350 mutants (gray column). Mean±SD; n=8 in each group, performed in triplicate. Statistical significance was determined using Student t-test; ****P<0.0001, **P<0.01, *P<0.05. ns: not significant.
1790
haematologica | 2018; 103(11)
