
Page 48 - 2018_11-Haematologica-web
P. 48
J. Lian et al.
A
B
C
D
E
F
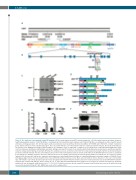
Figure 2. The alas1 gene was mutated in smu350 mutants. (A) The mutated gene in smu350 mutants mapped to a 100-kb region between two simple sequence length polymorphism markers, CU633745-M (two recombinants in 6160 smu350 mutant embryos) and CU929297-M (three recombinants in 6160 smu350 mutant embryos), on linkage group 11. The 100-kb region, partly covered by two bacterial artificial chromosomes (BACs) (CU633745 and CU929297), contains 9 predicted genes. (B) The structure of the zebrafish alas1 gene. The red asterisk indicates a T-to-A mutation in intron 7 of alas1 in smu350 mutants. The black arrow indicates the position of the CRISPR/Cas9 target in alas1. Numbers of constitutive exons are indicated. (C) Agarose gel electrophoresis of alas1 RT-qPCR amplification prod- ucts from 3-day post fertilization (dpf) wild-type zebrafish, siblings, and smu350 mutants. Four major products (indicated by black arrows) were identified in smu350 mutants compared with wild-type transcripts (461 bp). The actb2 was used as an internal control. (D) The mutated alas1 transcripts and their predicted translation products in smu350 mutants. The blue arrow indicates the position of the transcriptional start site. Black arrows indicate the RT-qPCR primers used in (C), and black boxes indicate the wild-type peptides. Red boxes indicate the incorrect peptides generated by the altered splicing. Pink boxes indicate the pre-sequence domain (pfam09029). Green boxes indicate the aspartate aminotransferase superfamily domain (fold type I) of pyridoxal phosphate-dependent enzymes (cl18945). Boxes with zigzag edges indicate truncated regions. Blue boxes with white numbers indicate exons. Black and red numbers denote distances to the start codon in wild- type and mutants, respectively. (E) alas1 expression was up-regulated in smu350 mutants. Relative expression of alas1 transcript assessed by RT-qPCR in smu350 mutants (gray column) and wild-type (black column) at 2, 3, 5, and 7 dpf [mean±Standard Deviation (SD); n=10 in each group, performed in triplicate]. Statistical significance was determined using Student t-test, ***P<0.001. (F) Alas1 protein was absent in smu350 mutants. Alas1 protein expression in the whole fish body assessed by western blotting at 5 dpf. GAPDH was used as the loading control.
1788
haematologica | 2018; 103(11)
