
Page 49 - 2018_11-Haematologica-web
P. 49
Regulation of neutrophil maturation in zebrafish
exon-intron boundary in smu350 mutants (Figure 2B), which is likely to be a splicing mutation. By amplifying alas1 cDNA from smu350 mutants, we found at least four unexpected alas1 transcripts (Figure 2C), which were con- firmed by sequencing analysis following TA cloning. These unexpected transcripts were predicted to produce truncated Alas1 proteins or in-frame-insertion Alas1 pro- teins, all of which would interrupt the enzyme activity domain of Alas1 (Figure 2D). Expression analyses by reverse transcription quantitative real-time polymerase chain reaction (RT-qPCR) showed elevated alas1 mRNA expression in smu350 mutants compared with siblings throughout development (Figure 2E). However, we found that neither the wild-type form nor the abnormal variants of Alas1 protein were present in smu350 mutants, as deter- mined by western blotting (Figure 2F). These data strongly suggest that this alas1 mutation is responsible for the smu350 mutant (hereafter named alas1smu350/smu350) phenotype and that the alas1smu350/smu350 mutant is a loss-of-function mutant.
To confirm that the alas1smu350/smu350 mutant phenotype was indeed caused by the alas1 mutation, we used CRISPR/Cas9 to create alas1-knock-out mutants. A homozygous alas1 mutant (alas1Δ2/Δ2) with a 2-bp deletion
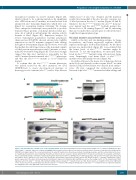
within exon 7 of alas1 was obtained, and the mutation resulted in a frameshift of the alas1 product, causing a loss of Alas1 protein in the alas1Δ2/Δ2 mutant (Figure 3A and B). Similar to the alas1smu350/smu350 mutant, the alas1Δ2/Δ2 homozy- gous mutant and the alas1smu350/Δ2 bi-allelic mutant also showed loss of SB staining (Figure 3C and D), indicating that alas1 is indeed the causative gene for the altered neu- trophil development phenotype.
The alas1 mutation caused heme deficiency
ALAS1 is the first and rate-limiting enzyme for heme biosynthesis, and heme negatively regulates ALAS1 expression through a feedback mechanism.10 As the Alas1 protein was undetectable (Figure 2F), we postulated that the heme levels of alas1smu350/smu350 mutants might be decreased. To test this hypothesis, we measured heme levels in alas1smu350/smu350 mutants using a fluorescence heme assay. Surprisingly, total heme levels of alas1smu350/smu350
mutants were abnormally elevated (Figure 4A).
As erythroid tissue is the major site of heme production in the body and depends on the isozyme Alas2,33 we then checked if this elevated heme was derived from erythro- cytes. We first compared the erythrocyte numbers between 4-dpf alas1smu350/smu350 mutants and their siblings and
AB
C
D
Figure 3. The alas1 was the causative gene of the smu350 mutant. (A) Sequencing analysis revealed a 2-bp deletion within exon 7 of alas1 in CRISPR/Cas9 gen- erated alas1Δ2/Δ2 mutants. Uppercase sequences highlighted blue indicate exons; sequences in lowercase indicate introns. Sequences underlined in red indicate the CRISPR/Cas9 target in alas1. The red asterisk indicates the smu350 mutation site. Black boxes indicate the wild-type peptides, and the red box indicates the incor- rect peptide generated by the altered splicing. The pink box indicates the pre-sequence domain (pfam09029). The green box indicates the aspartate aminotrans- ferase superfamily (fold type I) domain of pyridoxal phosphate-dependent enzymes (cl18945). The box with zigzag edges indicates the truncated region. Black and red numbers denote distances to the start codon in wild type and mutants, respectively. (B) Alas1 protein was absent in alas1Δ2/Δ2 mutants. Examination of Alas1 protein expression in the whole fish body by western blotting at 5 days post fertilization (dpf). GAPDH was used as the loading control. (C) The Sudan black B (SB) signal was absent in alas1Δ2/Δ2 mutants. SB staining in siblings (upper) and alas1Δ2/Δ2 mutants (lower) at 3 dpf. Boxed regions are magnified in the lower right-hand corner. Scale bars: 200 mm. (D) SB signal was absent in alas1smu350/Δ2 mutants. SB staining in siblings (upper) and alas1smu350/Δ2 mutants (lower) at 3 dpf. Boxed regions are magnified in the lower right-hand corner. Scale bars: 200 mm.
haematologica | 2018; 103(11)
1789
