
Page 51 - 2018_11-Haematologica-web
P. 51
Regulation of neutrophil maturation in zebrafish
found no significant differences (Figure 4B), indicating the elevated whole heme in mutants was not due to increased erythrocyte numbers. We next isolated neutrophils and erythrocytes of alas1smu350/smu350 mutants and their siblings by fluorescence-activated cell sorting (FACS) using 4-dpf self- progeny of Tg(lyz:DsRed)+/+;alas1smu350/+ and Tg(gata1:DsRed)+/+;alas1smu350/+ transgenic lines, respectively, to directly measure heme levels in the two cell types. By comparing relative heme levels in neutrophils or erythro- cytes between alas1smu350/smu350 mutants and their siblings, we found that heme was less abundant in neutrophils of alas1smu350/smu350 mutants than that of siblings (Figure 4C), while in erythrocytes, heme was more accumulated in erythrocytes of mutants (Figure 4D). These data indicate that alas1 mutation results in heme insufficiency in neu- trophils but abnormal accumulation in erythrocytes. To further confirm that the elevated heme of the whole body was derived from erythrocytes in alas1smu350/smu350 mutants, we introduced vltm651,34 (a gata1a mutant with a 'bloodless' phenotype having no erythrocytes but intact white blood cells) into the smu350 mutant background to eliminate the effect of erythrocytes. As expected, whole fish heme lev- els of alas1smu350/smu350 mutants were almost undetectable compared with those of siblings in the gata1a mutant background (Figure 4E). These data indicate that the aber- rant heme accumulation of the whole body is indeed derived from erythrocytes in alas1smu350/smu350 mutants.
Alas2, the other isozyme of Alas1, is essential for the heme biosynthesis in erythrocytes and predominantly expressed in erythrocytes.10 To test whether the erythroid heme increment resulted from the elevated alas2 expres-
sion, we checked alas2 expression in alas1smu350/smu350 mutants. The data showed that alas2 was not altered com- pared with that in siblings (Figure 4F), suggesting that the erythroid heme accumulation was not due to the compen- satory of alas2, at least at the transcription level. Since heme content is tightly controlled by the homeostasis of heme biosynthesis, degradation, and transport path- ways,35 we then detected the expression of heme oxyge- nase enzymes (hmox1a and hmox2a),10,36 which encode the rate-limiting enzymes for heme degradation. The results showed that both gene expressions were down-regulated in alas1smu350/smu350 mutants (Figure 4F), suggesting the impaired heme degradation in the absence of alas1. The results suggest that the dysregulation of heme biosynthe- sis affects the heme degradation in alas1smu350/smu350 mutants, and the elevated heme might be attributed to the reduced heme degradation. The elevated heme in erythrocytes could not be utilized by heme-deficient neutrophils in alas1 mutants, which is likely due to the fact that the syn- thesized heme in erythrocytes could not be transported to neutrophils. To test this hypothesis, we further detected the expressions of genes encoding heme transporters. Flvcr1a is reported to export heme out of the cell as a plas- ma membrane heme exporter.37 Hpx, a high-affinity heme-binding protein, is reported to interact with FLVCR in heme transfer.35 HRG-1 is reported to deliver heme to the cytosol,38 which is encoded by slc48a1a (heme trans- porter hrg1-B) and slc48a1b (heme transporter hrg1-A) in zebrafish. MRP-5/ABCC5 is reported to reside on the plas- ma membrane and endosomal compartments and regulate the export of cytosolic heme.39 RT-qPCR showed that the
AB
C
D
E
F
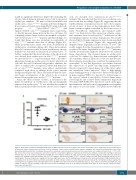
Figure 5. Heme was essential for neutrophil maturation. (A) Whole fish heme levels of succinylacetone (SA)-treated embryos were significantly decreased than those of untreated control. Relative whole fish heme levels in untreated control (circles) and SA-treated embryos (triangles) at 2 days post treatment (dpt). Lines show Mean±Standard Deviation (SD), 6 individual data points in each group, each data point was based on 3 measurements for 5 embryos; Student t-test: ***P<0.001. The relative heme level was normalized to per-fish level. (B) The o-Dianisidine signal was totally absent in SA-treated embryos. o-Dianisidine staining in untreated wild-type (left, 11 of 11 embryos) and SA-treated (right, 10 of 10 embryos) embryos at 2 dpt. (C) The Sudan black B (SB) signal was totally absent in SA-treated embryos. SB staining in untreated wild-type (left, 20 of 20 embryos) and SA-treated (right, 17 of 17 embryos) embryos at 2 dpt. Black arrowheads indicate the neu- trophil signals. The boxed regions are magnified in the lower right-hand corner. (D) The DAB signal was totally absent in SA-treated embryos. DAB staining in untreat- ed wild-type (left, 18 of 18 embryos) and SA-treated (right, 14 of 14 embryos) embryos at 2 dpt. Black arrowheads indicate the neutrophil peroxidase signals. The boxed regions are magnified in the lower right-hand corner. (E) WISH of lyz expression in untreated wild-type (left, 21 of 21 embryos) and SA-treated (right, 25 of 25 embryos) embryos at 2 dpt. (F) WISH of mpx expression in untreated wild-type (left, 23 of 23 embryos) and SA-treated (right, 15 of 15 embryos) embryos at 2 dpt. Scale bars: 200 mm (B-F).
haematologica | 2018; 103(11)
1791
