
Page 117 - 2018_10-Haematologica-web
P. 117
Pre-diagnosis plasma immune markers and NHL risk
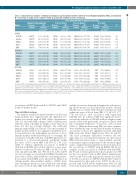
Table 3. Independent associations of multiple pre-diagnosis plasma immune markers with risk of non-Hodgkin lymphoma (NHL), overall and by B- or T-cell type of origin, for the complete follow-up period and stratified by years of follow up.
Years from blood draw to diagnosis/index date
Complete follow-up period 0 to less than 5
5 to less than 10 10 or more
Ncases/ OR Ncases/ OR P‡
Marker N cases/ controls
All NHL
sTNF-R2 542/571 sIL-2Rα 542/571 CXCL13 542/571 sCD30 542/571 BAFF 542/571
All B-NHL
sTNF-R2 454/570 sIL-2Rα 454/570 CXCL13 454/570 sCD30 454/570 BAFF 454/570
All T-NHL
sTNF-R2 28/569 sIL-2Rα 28/569 CXCL13 28/569 sCD30 28/569
BAFF 28/569
OR Ncases/ OR
(95% CI) per 1-SD *,†
1.05 (0.91, 1.21) 1.20 (1.03, 1.39) 1.17 (1.03, 1.32) 1.24 (1.06, 1.45) 0.74 (0.66, 0.83)
1.07 (0.92, 1.25) 1.20 (1.03, 1.41) 1.13 (1.00, 1.29) 1.24 (1.05, 1.46) 0.73 (0.64, 0.83)
0.62 (0.37, 1.03) 1.96 (1.22, 3.13) 1.11 (0.75, 1.65) 1.33 (0.84, 2.10)
0.88 (0.58, 1.32)
controls (95% CI) per 1-SD *,†
133/140 0.83 (0.60, 1.14) 133/140 1.52 (1.09, 2.11) 133/140 1.00 (0.78, 1.29) 133/140 1.52 (1.09, 2.13) 133/140 0.73 (0.59, 0.91)
110/140 0.88 (0.63, 1.23) 110/140 1.51 (1.06, 2.14) 110/140 0.96 (0.74, 1.25) 110/140 1.59 (1.10, 2.28) 110/140 0.67 (0.53, 0.84)
11/140 0.44 (0.17, 1.19) 11/140 2.10 (0.95, 4.68) 11/140 1.03 (0.48, 2.22) 11/140 1.68 (0.69, 4.08) 11/140 0.93 (0.52, 1.67)
controls (95% CI) per 1-SD *,†
149/162 1.02 (0.77, 1.35) 149/162 1.16 (0.88, 1.53) 149/162 1.30 (1.03, 1.62) 149/162 1.43 (1.07, 1.90) 149/162 0.61 (0.48, 0.78)
118/161 1.15 (0.86, 1.54) 118/161 1.12 (0.84, 1.49) 118/161 1.17 (0.92, 1.49) 118/161 1.58 (1.14, 2.20) 118/161 0.64 (0.50, 0.81)
10/160 0.65 (0.27, 1.58) 10/160 2.20 (0.93, 5.20) 10/160 1.37 (0.78, 2.42) 10/160 1.34 (0.56, 3.21) 10/160 0.55 (0.24, 1.28)
controls (95% CI) per 1-SD *,†
260/267 1.18 (0.95, 1.46) 0.20 260/267 1.11 (0.88, 1.39) 0.28 260/267 1.21 (1.01, 1.46) 0.32 260/267 0.98 (0.78, 1.23) 0.02 260/267 0.83 (0.69, 1.00) 0.15
226/267 1.13 (0.90, 1.42) 0.40 226/267 1.15 (0.91, 1.46) 0.38 226/267 1.24 (1.02, 1.50) 0.31 226/267 0.96 (0.75, 1.22) 0.02 226/267 0.84 (0.69, 1.02) 0.14
7/267 0.73 (0.24, 2.21) 0.78 7/267 1.04 (0.36, 3.00) 0.50 7/267 0.57 (0.24, 1.37) 0.26 7/267 1.77 (0.70, 4.43) 0.90 7/267 1.68 (0.64, 4.44) 0.23
N: number; NHL: non-Hodgkin lymphoma; B-NHL: B-cell NHL; T-NHL: T-cell NHL; OR: Odds Ratio; CI: Confidence Interval; SD: Standard Deviation; sTNF-R2: soluble tumor necrosis factor receptor-2; sIL-2Rα: soluble interleukin-2 receptor-α; CXCL13: CXC chemokine ligand 13; sCD30: soluble CD30; BAFF: B-cell activating factor of the TNF family. *Models were adjusted for age at blood draw (continuous), cohort (sex), time of blood draw (continuous) and race/ethnicity (Caucasian, non-Caucasian) and were mutually adjusted for all markers listed, except that models for all T-NHL were not adjusted for race. †Odds Ratios and 95% Confidence Intervals were calculated per 1-standard deviation increase in batch effect-corrected, log-transformed values (with cohort-specific outliers excluded) from the Nurses’ Health Study and Health Professionals Follow-up Study combined. ‡P-values from tests for heterogeneity comparing immune marker-specific estimates across time strata.
associations of DLBCL risk with IL-6, CXCL13 and sCD30 in this 13-marker model.
Time-stratified analyses
The analyses stratified by time between blood draw and diagnosis/index date suggested that the individual bio- marker associations with all NHL (Online Supplementary Table S7) and with NHL subtypes (Online Supplementary Table S8) varied somewhat by length of time after blood draw but did not strongly implicate any additional immune marker-NHL associations. The time-stratified 5- marker models (Table 3) also suggested variability by fol- low-up interval in the independent associations of those immune markers with future NHL risk. For example, the association of sIL-2Rα with risk of all NHL appeared to be restricted to a shorter-term interval, specifically within five years of blood draw (OR: 1.52, 95%CI: 1.09, 2.11) (Table 3), whereas significant associations of CXCL13 with risk of all NHL were evident only five or more years after blood collection (5-<10 years; OR: 1.23, 95%CI: 1.00, 1.52; and ≥10 years; OR: 1.21, 95%CI: 1.01, 1.45). sCD30 was most strongly associated with all NHL risk within ten years of blood draw, while BAFF was consistently inverse- ly associated with all NHL across time periods. Of note, in subtype-specific time-stratified analyses, sCD30 levels were strongly positively associated with risk of FL within five years of blood draw (OR: 4.85, 95%CI: 2.02, 11.61),
and the association decreased in magnitude with increas- ing follow-up time. In CLL/SLL-specific models, elevated sIL-2Rα was associated with a nearly 4-fold increased risk within five years of blood draw (OR: 3.71, 95%CI: 1.77, 7.76) but had no clear association with longer-term CLL/SLL risk. In contrast, BAFF had significant inverse associations with risk of CLL/SLL in all pre-diagnosis time periods, albeit with particularly strong associations with risk of CLL/SLL within five or ten years of blood draw (Table 4). When modeled using PLR, the effect estimates were virtually the same for time period-specific biomarker associations, both for the aggregated and the individual NHL end points (Online Supplementary Tables S4 and S5). The most prominent differences between the two approaches for assessing heterogeneity by time period (PLR with interaction terms vs. time-stratified uncondi- tional logistic regression) pertained to the statistical signif- icance of apparent heterogeneity by follow-up period for the associations of sTNF-R2 with all B-NHL and FL. For example, for the association of sTNF-R2 with all B-NHL, the P-value for heterogeneity by follow-up time was 0.04 for the cross-product term in PLR (Online Supplementary Table S4) and 0.40 for the main model contrast test (Table 3). For the association of sTNF-R2 with FL, the P-value for heterogeneity by time period was 0.0007 for the cross- product term in PLR (Online Supplementary Table S5) and 0.11 for the main model contrast test (Table 4). Time-strat-
haematologica | 2018; 103(10)
1683
