
Page 115 - 2018_10-Haematologica-web
P. 115
Pre-diagnosis plasma immune markers and NHL risk
We omitted 109 individual biomarker measurements (<1% of all measurements) with implausible outlying val- ues (NHS: 72; HPFS: 37), the majority (90%) of which were implausibly high for the particular marker. Omitted values ranged from one measure of IL-10 to 17 measures of IL-8. Spearman correlation coefficients ranged from -0.03 (IL-10 and CXCL13) to 0.58 (sIL-2Rα and sCD30) (Online Supplementary Table S2).
Individual immune marker models
Multivariable analyses of individual log-transformed immune markers revealed significant associations for all NHL per SD increment of log-transformed sTNF-R2, sIL- 2Rα, CXCL13, sCD30 (all positive) and BAFF (inverse; Table 2). In subtype-specific analyses, sTNF-R2 levels were also positively associated with risk of all B-NHL, FL and CLL/SLL, while CXCL13 was positively associated
with risk of all B-NHL, DLBCL and FL (Table 2). Levels of sIL-2Rα and sCD30 were positively associated with every NHL subtype, including T-NHL. Of interest, the associa- tion of BAFF with a 17% decreased risk of all NHL appeared to be driven by CLL/SLL, for which risk decreased by 49% per SD increase in log-transformed BAFF levels (OR: 0.51; 95%CI: 0.43, 0.62; P<0.001); BAFF was not associated with other NHL subtypes in single- marker models. We did not observe significant or consis- tent associations for the remaining immune markers with risk of any NHL end point. Results from cohort-specific models did not suggest marked differences by sex for these associations (Online Supplementary Table S3).
Multi-marker profiles
In the model that mutually adjusted for the five log- transformed immune markers that had significant individ-
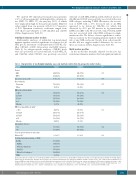
Table 1. Characteristics of non-Hodgkin lymphoma cases and matched controls from two prospective cohort studies.
Variable
Cohort NHS HPFS
Age, years, mean ± SD Race/ethnicity
Caucasian
Other
BMI at blood draw, kg/m2
< 22.5 22.5-24.9 25-29.9 ≥ 30 Missing
BMI in young adulthood, kg/m2 < 18.5
18.5-22.4 22.5-24.9 ≥25 Missing
Autoimmune disease†
Yes
Cases
344 (58%) 254 (42%) 60.8 ± 8.1
573 (96%) 25 (4%)
138 (23%) 139 (23%) 217 (36%) 74 (12%) 30 (5%)
44 (7%) 298 (50%) 126 (21%) 106 (18%) 24 (4%)
97 (16%)
Controls P* 345 (57%) 0.97
256 (43%)
60.8 ± 8.1 0.87
578 (96%) 0.75 23 (4%)
118 (20%) 0.58 166 (28%)
219 (36%)
74 (12%)
24 (4%)
54 (9%) 0.31 299 (50%)
112 (19%)
101 (17%)
35 (6%)
104 (17%) 0.62
No
Years from blood draw to index date,
Mean±SD 9.6±5.6 9.6±5.6 0.99 Cell type/histological subtype of NHL‡
501 (84%)
503 (84%)
114 (19%)
92 (15%)
165 (28%)
132 (22%)
30 (5%)
497 (83%)
B-NHL
DLBCL
Follicular lymphoma CLL/SLL
Other B-cell subtypes§
T-NHL
SD: Standard Deviation; NHS: Nurses' Health Study; HPFS: Health Professionals Follow-up Study; BMI: Body Mass Index; NHL: non-Hodgkin lymphoma; B-NHL: B-cell NHL; DLBCL: diffuselargeB-celllymphoma;CLL/SLL:chroniclymphocyticleukemia/smalllymphocyticlymphoma;T-NHL:T-cellNHL.*P-valuesfromχ2 testorANOVA.TestsforBMIatblood draw and BMI in young adulthood did not include individuals’ missing data for those variables. †Defined as any self-reported diagnosis of rheumatoid arthritis, ulcerative colitis, multiple sclerosis, psoriasis, or Sjögren syndrome. ‡Information on cell type was not available for 11% of NHL cases. §The other B-NHL subtypes include Burkitt lymphoma (n=4), lymphoplasmacytic lymphoma (n=19), mantle cell lymphoma (n=20), marginal zone lymphoma (n=44), other B-NHL (n=20), and unclassified B-NHL (n=25).
haematologica | 2018; 103(10)
1681
