
Page 116 - 2018_10-Haematologica-web
P. 116
M.M. Epstein et al.
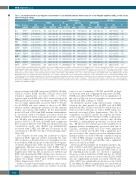
Table 2. Associations between pre-diagnosis concentrations of 13 individual immune markers and risk of non-Hodgkin lymphoma (NHL), overall and by major histological subtype.
All NHL* B-NHL Subtypes All T-NHL DLBCL FL CLL/SLL Other B-NHL†
MarkerNcases/ OR N OR N OR N OR N OR N OR P§
controls
IL-6 597/600
IL-8 558/566
(95% CI)‡ cases (95% CI)‡ cases (95% CI)‡ cases (95% CI)‡ cases (95% CI)‡
0.97(0.87,1.08) 114 1.12(0.91,1.37) 92 0.90(0.73,1.12) 165 0.99(0.84,1.17) 131 0.89(0.74,1.08)
1.00(0.88,1.13) 1.00(0.89,1.11) 1.02(0.91,1.14) 1.06(0.94,1.19) 1.01(0.90,1.15) 1.03(0.89,1.18) 1.25(1.12,1.40) 1.10(0.98,1.23) 0.83(0.75,0.92) 1.37(1.23,1.53) 1.31(1.17,1.46)
cases (95% CI)‡
30 1.13(0.78,1.63) 0.46
29 0.82(0.54,1.26) 0.70 30 1.21(0.83,1.76) 0.18 29 1.14(0.78,1.67) 0.17 30 0.97(0.66,1.42) 0.50 30 0.94(0.62,1.43) 0.55 30 0.81(0.48,1.36) 0.57 30 1.03(0.70,1.50) 0.20 30 1.01(0.69,1.46) 0.32
106 0.96(0.77,1.22) 84 1.07(0.84,1.36) 156 0.98(0.81,1.20) 120 1.11(0.90,1.37) 113 1.14(0.93,1.40) 91 0.98(0.78,1.22) 165 0.85(0.72,1.01) 132 1.04(0.86,1.25)
108 0.98(0.80,1.21) 87 1.16(0.92,1.47) 158 1.06(0.89,1.26) 120 0.82(0.68,1.00) 114 1.12(0.92,1.38) 92 1.12(0.89,1.40) 165 0.93(0.77,1.12) 130 1.15(0.94,1.40) 114 0.90(0.72,1.13) 90 0.97(0.76,1.25) 164 0.91(0.75,1.11) 130 1.14(0.93,1.40)
114 0.87(0.66,1.15) 91 1.15(0.90,1.47) 163 1.00(0.80,1.25) 130 0.99(0.79,1.26)
114 1.02(0.83,1.26) 90 1.37(1.10,1.70) 164 1.28(1.08,1.51) 129 1.35(1.13,1.62) 114 0.89(0.72,1.10) 91 1.16(0.93,1.44) 165 1.15(0.97,1.36) 128 1.13(0.93,1.37) 114 0.99(0.81,1.21) 92 0.93(0.73,1.17) 163 0.51(0.43,0.62) 128 0.87(0.73,1.05)
114 1.26(1.04,1.54) 91 1.55(1.25,1.94) 162 1.49(1.27,1.76) 126 1.40(1.16,1.68)
107 1.25(1.03,1.52) 86 1.58(1.28,1.95) 156 1.10(0.93,1.31) 116 1.48(1.24,1.76)
114 1.29(1.06,1.56) 90 1.76(1.44,2.15) 163 1.33(1.13,1.57) 131 1.29(1.09,1.54)
IL-10 596/597
TNF-α 566/571
CRP 596/599
sCD14 592/596
sGP130 592/596
sTNF-R2 592/601
sIL-6Rα 592/599
BAFF 592/601
30 1.26(0.87,1.82)
<0.0001
sIL-2Rα 585/600
30 1.97(1.37,2.85) 0.26
28 1.23(0.86,1.76) 0.06
29 1.46(1.05,2.04) 0.15
CXCL13 554/571
sCD30 590/600 1.37(1.23,1.52)
N: number; NHL: non-Hodgkin lymphoma; B-NHL: B-cell non-Hodgkin lymphoma; DLBCL: diffuse large B-cell lymphoma; FL: follicular lymphoma; CLL/SLL: chronic lymphocytic leukemia/small lymphocytic lymphoma; T-NHL: T-cell NHL; OR: Odds Ratio; CI: Confidence Interval; IL: interleukin; TNF: tumor necrosis factor; CRP: C-reactive protein; sCD14: soluble CD14; sGP130: soluble GP130; sTNF-R2: soluble tumor necrosis factor receptor-2; sIL-6Rα: soluble interleukin-6 receptor-α; BAFF: B-cell activating factor of the TNF family; sIL-2Rα: soluble interleukin-2 receptor-α; CXCL13: CXC chemokine ligand 13; sCD30: soluble CD30. *The all B-NHL (n=503 cases) results were similar to the all NHL results. †Other B-NHL subtypes include Burkitt lymphoma (n=4), lymphoplasmacytic lymphoma (n=19), mantle cell lymphoma (n=20), marginal zone lymphoma (n=44), other B-NHL (n=20), and unclassified B-NHL (n=25). ‡Odds Ratios and 95% Confidence Intervals were calculated per 1 standard deviation increase in log biomarker concentration,based on batch-corrected values with outliers removed,for NHS and HPFS cohorts combined. All models except those for T-NHL were adjusted for age at blood draw (continuous), cohort, time of blood draw (continuous), race (Caucasian/other); the models for T-NHL were adjusted for age and cohort only. §P-values for heterogeneity by subtype from contrast tests comparing immune marker-specific estimates between DLBCL, FL, CLL/SLL, other B-NHL, and T-NHL.
ual associations with NHL end points (sTNF-R2, sIL-2Rα, CXCL13, sCD30, BAFF), sIL-2Rα, CXCL13 and sCD30 remained significantly associated with a 17-24% increased risk, and BAFF with a 26% decreased risk of all NHL per SD increase in log concentration, while sTNF-R2 was no longer significantly associated (Table 3). Results for all B-NHL risk were similar to those for all NHL, whereas mutual adjustment attenuated all the immune marker associations with DLBCL. In the multi-marker model of FL risk, sCD30 and BAFF remained independent- ly associated, with a borderline association noted for CXCL13 (Table 4). In the multi-marker model of CLL/SLL risk, sIL-2Rα was significantly associated with a 50% increase (95%CI: 1.18-1.90), and BAFF with a significant 53% reduction (95%CI: 0.38, 0.58), per SD increase in log concentration. Lastly, only sIL-2Rα was independently associated with T-NHL risk (OR per SD increase in log concentration: 1.96; 95%CI: 1.22, 3.13) in mutually adjust- ed models.
The 5-marker models using the polytomous logistic regression (PLR) approach yielded essentially the same effect estimates as described above for biomarker associa- tions with the NHL end points for the full follow-up peri- od (Online Supplementary Tables S4 and S5). sTNF-R2 had significantly different associations with B-NHL and T- NHL (P-value for heterogeneity by subtype=0.04) (Online Supplementary Table S4); the associations of CXCL13 and BAFF with individual B-NHL subtypes also showed evi- dence of significant heterogeneity (P-values for hetero- geneity by subtype =0.007 and <0.0001, respectively) (Online Supplementary Table S5).
In the covariable-adjusted multi-marker models contain- ing restricted cubic splines, there was evidence of non-lin-
earity for two biomarkers, CXCL13 and BAFF, in their associations with risk of aggregated end points (all NHL, B-NHL and other B-NHL; P-value tests for significance of the curve <0.05), but not for biomarker associations with individual B-NHL subtypes or T-NHL.
In alternative models using semi-automatic stepwise selection, the final models for all NHL and all B-NHL included sIL-2Rα, CXCL13 and sCD30, which were posi- tively associated with risk, as well as BAFF, which was inversely associated (Online Supplementary Table S6). In comparison, for DLBCL and FL, the stepwise procedure selected only sCD30 (P=0.004 and <0.0001, respectively), and for T-NHL the procedure selected only sIL-2Rα (P=0.002) as independently (positively) associated with risk. Of interest, the stepwise procedure identified four immune markers independently associated with risk of CLL/SLL, including BAFF and IL-10 with significant inverse associations and sIL-2Rα with a significant posi- tive association. The stepwise procedure identified three immune markers associated with the combined category of other B-NHL subtypes, including significant positive associations for CXCL13 and sIL-2Rα, and a significant inverse association for BAFF.
In the model that included all 13 immune markers, sIL- 2Rα , CXCL13, and sCD30 again had strong positive asso- ciations with risk of all NHL and all B-NHL (Table 5). In the CLL/SLL-specific model, we observed a significant inverse association with risk for BAFF and also for sCD14 and IL-10, and a positive association with sIL2-Rα. BAFF was also significantly inversely associated with FL risk, while sCD30 was significantly positively associated with FL risk. Only sIL-2Rα was significantly associated with an increased risk of T-NHL. We observed suggestive positive
1682
haematologica | 2018; 103(10)
