
Page 119 - 2018_10-Haematologica-web
P. 119
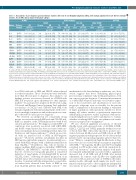
Table 5. Associations of pre-diagnosis plasma immune markers with risk of non-Hodgkin lymphoma (NHL), with mutual adjustment for all thirteen immune markers, for all NHL and by major histological subtype.
BAFF 523/550
sIL-2Rα 523/550
CXCL13 523/550
sCD30 523/550
haematologica | 2018; 103(10)
Pre-diagnosis plasma immune markers and NHL risk
All NHL Marker NCases/
DLBCL Ncases OR
(95% CI) per 1-SD*,†
104 1.22 (0.96, 1.55)
104 0.92 (0.72, 1.18)
B-NHL Subtypes
FL CLL/SLL
Other B-NHL‡
All T-NHL
N OR cases (95% CI)
per 1-SD*,†
28 1.10 (0.71, 1.73)
28 0.65 (0.40, 1.07)
Controls
IL-6 523/550
IL-8 523/550
OR (95% CI) per 1-SD *,†
N OR N cases (95% CI) cases per 1-SD*,†
78 0.86 (0.66, 1.12) 150
78 0.94 (0.71, 1.24) 150
OR (95% CI) per 1-SD*,†
1.10 (0.89, 1.37)
1.00 (0.79, 1.26)
N cases
106
106
OR (95% CI) per 1-SD*,†
1.03 (0.81, 1.31)
1.11 (0.88,1.38)
IL-10 523/550
1.06 (0.93, 1.21)
0.96 (0.83, 1.10)
0.95 (0.84, 1.07)
1.00 (0.87, 1.15)
1.00 (0.87, 1.15)
0.84 (0.71, 1.00)
1.06 (0.85, 1.32)
1.06 (0.86, 1.31)
1.03 (0.89, 1.20)
0.73 (0.64, 0.82)
1.19 (1.02, 1.40)
1.18 (1.04, 1.34)
1.26 (1.06, 1.48)
TNF-α 523/550
CRP 523/550
sCD14 523/550
sGP130 523/550
sTNF-R2 523/550
sIL-6Rα 523/550
104 1.14 (0.91, 1.43) 78 0.93 (0.72, 1.22) 150 0.80 (0.65, 0.99) 106 0.99 (0.79, 1.23) 104 0.84 (0.66, 1.08) 78 1.09 (0.81, 1.46) 150 1.09 (0.87, 1.37) 106 0.86 (0.67, 1.10)
104 1.07 (0.84, 1.37) 78 1.29 (0.96, 1.72) 150 0.82 (0.65, 1.04) 106 1.00 (0.77, 1.29)
104 0.82 (0.61, 1.11) 78 0.84 (0.61, 1.18) 150 0.68 (0.51, 0.89) 106 0.92 (0.68, 1.24) 104 1.05 (0.71, 1.55) 78 1.20 (0.78, 1.86) 150 1.11 (0.78, 1.58) 106 0.84 (0.57, 1.22)
104 0.96 (0.67, 1.37) 104 0.86 (0.66, 1.12) 104 0.98 (0.78, 1.23)
78 0.88 (0.57, 1.36) 150 78 1.02 (0.74, 1.40) 150 78 0.74 (0.56, 0.97) 150
1.33 (0.94, 1.87) 1.14 (0.90, 1.45) 0.46 (0.37, 0.57)
106 1.16 (0.81, 1.65) 106 1.19 (0.91, 1.56) 106 0.76 (0.62, 0.94)
104 1.09 (0.82, 1.44) 78 1.09 (0.77, 1.54) 150 1.59 (1.23, 2.06) 106 1.10 (0.83, 1.46)
104 1.20 (0.96, 1.49) 78 1.22 (0.94, 1.59) 150 0.92 (0.74, 1.13) 106 1.45 (1.18, 1.78)
104 1.27 (0.96, 1.66) 78 1.80 (1.30, 2.50) 150 1.10 (0.84, 1.45) 106 1.13 (0.85, 1.52)
N: number; B-NHL: B-cell NHL; SD: Standard Deviation; OR: Odds Ratio; CI: Confidence Interval; DLBCL: diffuse large B-cell lymphoma; FL: follicular lymphoma; CLL/SLL: chronic lymphocytic leukemia/small lymphocytic lymphoma;T-NHL: T-cell NHL; IL: interleukin;TNF: tumor necrosis factor; CRP: C-reactive protein; sCD14: soluble CD14; sGP130: soluble GP130; sTNF-R2: soluble tumor necrosis factor receptor-2; sIL-6Rα: soluble interleukin-6 receptor-α; BAFF: B-cell activating factor of the TNF family; sIL-2Rα: soluble interleukin-2 receptor-α; CXCL13: CXC chemokine ligand 13; sCD30: soluble CD30.*From multivariable logistic regression models that include all 13 immune markers in each model,adjusted for age at blood draw,time of day of blood draw,race and cohort. T-NHL models were not adjusted for race due to sparse cell counts. †Odds Ratios and 95% Confidence Intervals were calculated per 1 standard deviation increase in biomarker concentration, based on batch effect-corrected log-transformed values with outliers removed, for Nurses’ Health Study and Health Professionals Follow-up Study cohorts combined. ‡Other B-NHL subtypes included Burkitt lymphoma (n=4), lymphoplasmacytic lymphoma (n=19), mantle cell lymphoma (n=20), marginal zone lymphoma (n=44), other B-NHL (n=20), and unclassified B-NHL (n=25).
for sCD30 with risk of NHL and DLBCL when adjusted for other biomarkers. Those observations were detectable more than 15 years prior to diagnosis. Also similar to our findings, positive associations observed for sTNF-R2 with NHL did not persist upon adjustment for other immune markers.11 In a prospective analysis in the Prostate, Lung, Colorectal and Ovarian Cancer Screening Trial, individual associations of CXCL13 and sTNF-R2 with NHL both remained significant with mutual adjustment, with correc- tion for multiple comparisons and with restriction to sam- ples collected 8-13 years prior to diagnosis.10
We observed an unexpected yet consistently strong inverse association between BAFF levels and CLL/SLL risk. BAFF is a member of the TNF family involved with B-cell survival and maturation.27 Pre-diagnosis serum BAFF con- centrations were positively associated with AIDS-NHL, and BAFF overproduction has been associated with sys- temic autoimmune diseases, including systemic lupus ery- thematosus and Sjögren syndrome,28,29 which are associat- ed with an increased risk of NHL in HIV-negative persons.30,31 However, systemic autoimmune disorders in HIV-negative individuals appear to be preferentially asso- ciated with NHL subtypes with a different natural history than CLL/SLL.30,32 Nonetheless, CLL cells are known to express multiple BAFF receptors (including TNFRSF13B, TNFRS13C and TNFRSF17),33 and the inverse association that we observed is biologically plausible if considered indicative of rapid uptake of circulating BAFF by nascent CLL/SLL clones,34 reflecting subclinical progression of an indolent tumor whose natural course may extend multiple decades. Consistent with this interpretation, several clini- cal studies have observed lower levels of BAFF in sera from CLL/SLL patients than in healthy controls.35-37 The
mechanism for the latter findings is unknown; our obser- vation suggests that those underlying physiological processes may commence early in CLL pathogenesis, even ten or more years pre-diagnosis. Concurrent measurement of soluble BAFF receptors and study of cell surface expres- sion of those molecules and classification of cases into prognostic subgroups were not feasible for the present study. Confirmation of the present findings is warranted in larger populations with specimens suitable for deter- mining cell surface marker or gene/protein expression. Additionally, prospective studies in patients with mono- clonal B-lymphocytosis would be informative to evaluate whether circulating BAFF levels can enhance risk stratifi- cation for progression to malignancy.38
We also observed significant associations of elevated sIL-2Rα levels with increased risks of all NHL, B-NHL, DLBCL, CLL/SLL and T-NHL, primarily within five years of blood draw. One other study reported a positive asso- ciation between sIL-2Rα levels and NHL risk in an HIV- negative population with prospective blood collection that persisted after incorporating lag-times greater than two years.14 Of note, comparatively high sIL-2Rα levels at diag- nosis were also associated with poor prognosis in patients with NHL.39-41 Biologically, sIL-2Rα and sCD30 are highly correlated (r=0.58 in this study), and both can indicate B- and T-cell activation;42 in the present analysis, both mark- ers remained independently associated with a significant increased risk of all NHL and all B-NHL after mutual adjustment. In contrast, only sIL-2Rα was significantly associated with an increased risk of T-NHL in the multi- marker models, although small sample size (n=30 cases) limited statistical power to detect significant independent associations for more strongly correlated biomarkers. Of
28 1.19 (0.77, 1.82) 28 1.18 (0.74, 1.89)
28 0.85 (0.54, 1.34)
28 0.90 (0.51, 1.56) 28 0.76 (0.36, 1.60)
28 0.75 (0.38, 1.46) 28 1.11 (0.67, 1.84) 28 0.88 (0.58, 1.34)
28 1.95 (1.22, 3.10)
28 1.20 (0.80, 1.82)
28 1.25 (0.76, 2.05)
1685
